ECIA’s Electronic Component Sales Trend Sentiment (ECST) survey participants in February 2024 delivered very encouraging outcomes. The survey sentiment returns to positive territory for first time in 21 months.
Driven by strong improvements in the index scores for Passive Components and Electro-Mechanical/Connector Components the overall ECST index moved into positive sales sentiment territory with a score of 100.8. It has been 21 months since the overall sales sentiment index topped 100.
The index languished at an average of 85.2 for the prior year, unable to sustain any meaningful improvement until a positive surge to begin 2024 started in January. This momentum carried over into February with the encouraging outcome of an overall positive sentiment score.
The only disappointment in the results came in the index score for Semiconductors as it dropped by more than 18 points to a score of 93.3. This pessimism is consistent with the generally gloomy Q1 guidance reported by major semiconductor manufacturers. By contrast the scores for Passive Components and Electro-Mechanical/Connector Components jumped up by 14.2 and 12.3 points respectively. The positive momentum is projected to
carry into March with a projected improvement of 9 points in the overall average to nearly reach 110 points.
The index scores for all three major component categories are projected to top 100 in March. Electro-Mechanical components are forecast to improve by an impressive 13.3 points to top 120 followed by Passives with a 7.0-point rise to hit 109.2 points. With an expected increase of 6.7 points Semiconductors are forecast to eke out a score of 100.0 in March. Following the established pattern of perspective, Distributors deliver the most optimistic scores followed by Manufacturers.
General pessimism continues to be expressed by Manufacturer Representatives. In the March outlook Distributors and Manufacturers overall scores are both projected to top 100 index points. Also, Manufacturer Representatives express some of the best sentiment in many months with an outlook that reaches 91.7 points. While it was difficult for actual sentiment scores to achieve very optimistic outlooks in recent months, the projection of a 9-point improvement between February and March would seem very doable. The most important element of the outlook is to sustain overall sentiment above 100 points in the positive growth expectation territory.
The longer-term outlook presented by the Q1 2024 ECST survey delivers more positive news for the electronic components industry. In Q1 2024 the overall net index score delivers a positive 1% outcome. This is boosted significantly by net positive scores of 16% and 6% in Electro-Mechanical and Passive Components respectively. Semiconductors, consistent with published guidance by major manufacturers, delivers a net negative growth score of -17%. The best part of this survey is the outlook for Q2 2024 as positive energy sweeps across the market.
The Electro-Mechanical segment reports net positive sentiment of 46% and Passives with net positive results of 37%. Semiconductors join them with a strong net positive score of 17%. It is clear that this positive sentiment is dominated by expectations of growth between +1% to +3%. On the other hand, only 12% of respondents reported any level of negative growth expectations for Q2. In sum, the survey sets expectations for modest, yet solid, growth in Q2.
Avionics/Military/Space, Medical, and Industrial Electronics continue to be the strong drivers of positive sentiment in the end-market index. Improved ratings in most of the end-market segments drove an overall market index improvement of 11.4 points in February pushing the index above 100 to 104.3. This is in line with the overall product index and close to the forecast for February. Automotive and Telecom Network equipment are projected to join the 100+ club in March. Computers and Consumer Electronics will also see favorable improvements above 95 in this outlook. Only Mobile Phones languish around 85.3 in the March forecast. This broad-based improvement in the end-market forecast drives an overall index score above 117 for March. With two months of strong improvements in overall index scores and a solid outlook for March and Q2, 2024 is off to a highly encouraging beginning.
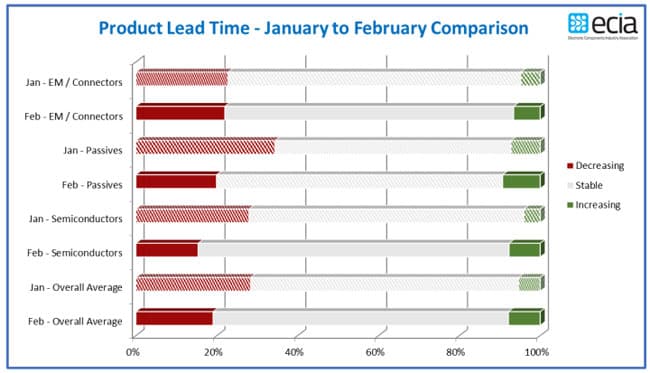
Stable lead times continue to expand the share of reports by survey participants in February. Overall stable lead time reports expanded from 66% to 73% between January and February. This comes at the expense of decreasing lead time reports that fell from 28% to 19% in this same time. The good news is that the increase in lead time reports grew by a minor 3% to reach only 8% in February. The quarterly ECST survey provides a complimentary view to the lead time results.
This survey shows inventory levels at the “Right Amount” reported by 44% to 69% of respondents depending on the category. “Excess Inventory” is reported by 26% to 48% of respondents for these same categories. The overall assessment of the supply chain shows a stable environment where a significant level of inventory remains to be reduced.
