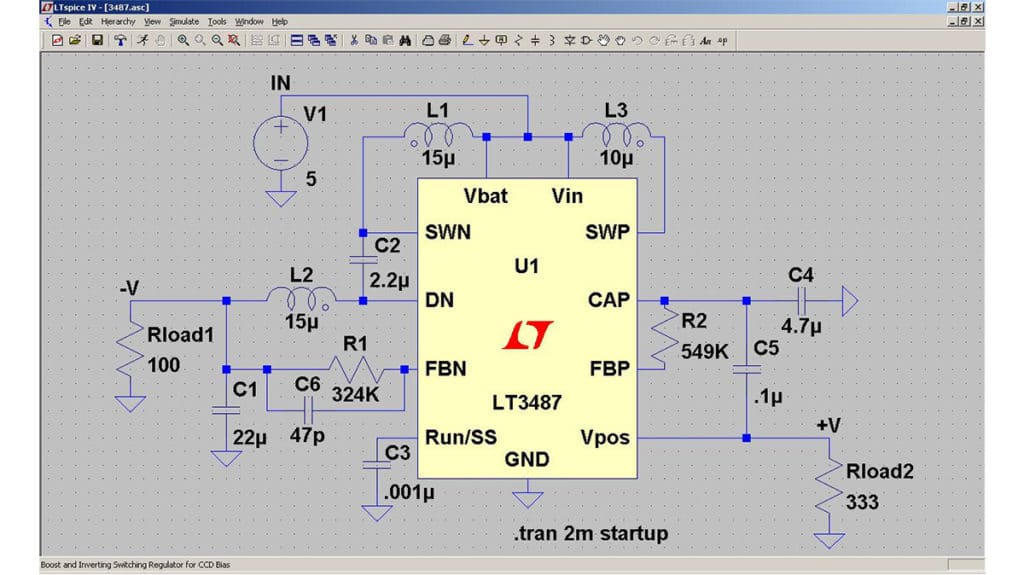
With LTSpice, Linear Technology has developed a high quality freeware SPICE simulator with no limitations on nodes or components and whose command set is largely compatible with other SPICE versions.
Here are a few of the software highlights:
- Comfortable circuit diagram editor
- Integrated voltage and current probes
- Efficiency report for switching controller applications
- Extensive component library
- Passive components R,L,C prepared as real components (editable) Library for SMD ferrites Active components Integrated calculation tools for analysis
- FFT function
- Extensive help function
- Automatic update
Fig. 1.72: SwitcherCADIII: Screenshot with analyser window and circuit diagram editor
Depending on its position in the circuit diagram editor, the mouse pointer changes between the two probe symbols:
Voltage measurement at the selected node
Current measurement through the selected component
Fig. 1.73: Example of voltage measurement with subsequent curve profile calculation
The component library includes the following Würth Elektronik components as a special feature:
- SMD ferrite WE-CBF
- Current-dependent SMD ferrite model (Z[I] for WE-CBF high current SMD ferrite)
- Current-compensated choke as a broadband model > 1 GHz (subcircuit models)
- Transformer models (subcircuit models) → in preparation
Fig. 1.74: Component library for SMD ferrites
Fig. 1.75: An overview of the most important operating functions
Example of EMC simulation
Simulation of EMC ferrite filters combined with capacitors and resistors represents a typical application example. The simulation achieves the most realistic results the more the RF equivalent circuit diagrams of the components, boards, connectors, leads and sources are taken into account in creating the circuit in the simulation program.
Numerous practical tips for real components and their parasitic component values are to be found in this book; here are some typical values:
Fig. 1.76: Equivalent circuit diagrams and values for real components
Impedance of the supply voltage connection of an IC
The parasitic elements of an IC are significantly influenced e.g. by the packaging, the internal wire bonds, the number and configuration of the Vcc pins and the die layout. The IC manufacturers increasingly undertake efforts to minimise the parasitic elements and also to specify them. This allows information on the impedance behaviour to be issued.
Fig. 1.77: Simulation circuit for the determination of the impedance of an IC
The test circuit shown above represents the IC under investigation with L2/R3/C1, the impedance of the board with C2/R2, and the impedance of the SMA connector used with R1/L1. The simulation now allows the measurement of impedance behaviour at the SMA connector to be shown without complication:
Fig. 1.78: Impedance of an IC → a resonance peak occurs at 500 MHz, the typical impedance is around 10 Ω
Insertion loss of ferrite filters
Fig. 1.79: Simulation circuit for the insertion loss of EMC filters
It is important to consider that the unfiltered system (node n004 here) also has to be simulated in the insertion loss simulation to obtain the correct relationship (see → insertion loss).
The special feature of LTspice is that the EMC SMD ferrite is already integrated and can be directly entered in the circuit diagram editor. The filter response can appear as follows and be optimised accordingly:
Fig. 1.80: Simulation result for the insertion loss of the EMC filters from Figure 1.79
