The July Industry Pulse Survey by ECIA paints a positive picture of sales sentiment across all product segments and end-markets.
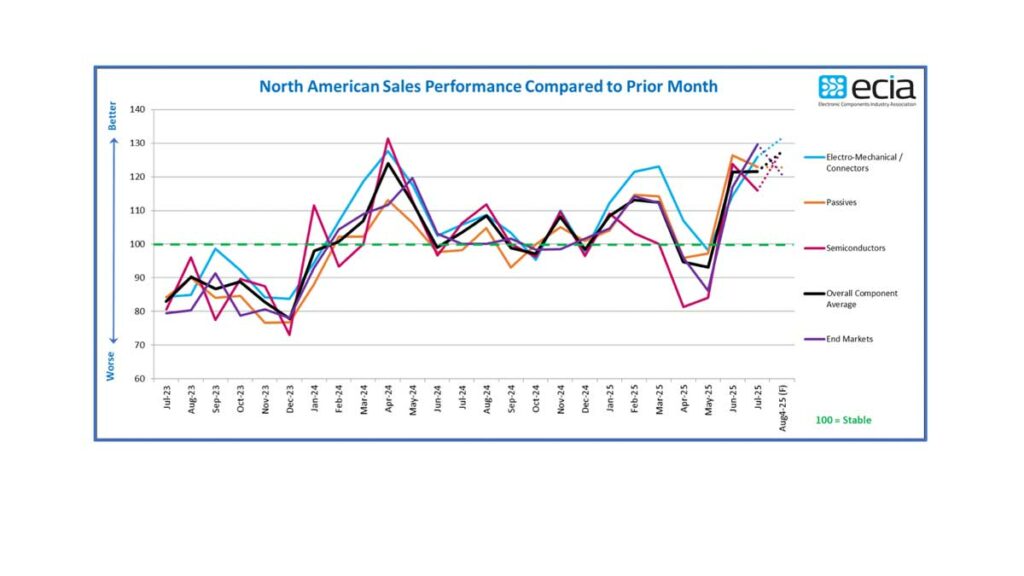
The overall average product index score remained steady compared to June, with a score of 121.6 in July. This follows a significant increase in the overall index between May and June. Remarkably, the outlook for August improves over July, with an increase in the index score to 127.5.
If this projection materializes, it would be the strongest index score since February 2022, three and a half years ago.
In recent surveys, ECIA began measuring sales sentiment compared to the same month in the previous year. These year-over-year measurements reveal even stronger results than the month-to-month perspective.
The year-over-year average product index score for July stands at 151, with the lowest product score being 129. The overall end-market score compared to last year also shows strong results, with an index score of 145. Clearly, the sales environment for electronic components has experienced a robust recovery since the summer of 2024.
Electro-Mechanical/Connector Components continued to lead all categories with its strong index score of 125.9, an increase of 11.5 from June. This category remains optimistic about August, projecting a score of 131.5.
Semiconductors and Passive Components, on the other hand, experienced a slight dip in their June levels. However, both categories exceeded their projections for July from the June survey. The survey results suggest that Semiconductor optimism is key to strong growth in August, with a projected score of 128. The positive July Industry Pulse results align with the most recent U.S. economic results, as the government released very favorable statistics for the second quarter of 2025. Hopefully, this favorable economic climate will persist and enable further improvements in sales of electronic components.
Manufacturer Representatives once again delivered the most robust scores for sales sentiment in July.
In every component category, the overall index score reported by this group surpassed 148 in July. While their assessment was relatively conservative, Manufacturers and Distributors still achieved overall average July scores of 109 and 104, respectively. Notably, the overall end-market index score outperformed the product category scores, reaching 129.7 in July. Each individual end-market surpassed the 100-point threshold in July, with the Industrial and Avionics/Military/Space segments leading the way at 139.3 and 136.5, respectively. Looking ahead to August, all markets except Mobile Phones are expected to maintain scores above 100. The consistent positive results from June through the August outlook reinforce the optimistic picture these results present. Hopefully, this renewed sales momentum can be sustained until the end of 2025.
Reports for lead time scores continue to indicate a stable environment, despite a noticeable increase in reports of rising lead times. Participants reporting increasing lead times rose from an average of 9% in June to 23% in July. In contrast, only 2% reported decreasing lead times, highlighting the dominance of stability in the picture, with 75% observing a stable environment. As more tariff agreements are finalized between the U.S. and other major countries and economies, it is hoped that this will foster a healthy geopolitical environment that will contribute to the sustainability of a robust supply chain.