
This paper explores degradation of electrical parameters in different types of aluminum capacitors and tantalum hermetically sealed capacitors during long-term storage at high temperatures up to 150°C.
The paper was presented by Alexander Teverovsky, Jacobs Engineering, Inc./NASA GSFC, USA at the 4th PCNS 10-14th September 2023, Sønderborg, Denmark as paper No. 3.6. selected by TPC Technical Program Committee as:
PAPER AWARD NOMINATION LIST
ABSTRACT
Aluminum electrolytic capacitors (AEC) are available to higher ranges of capacitance and voltage compared to tantalum electrolytic capacitors (TEC). However, evaporation of the electrolyte during operation or storage of conventional AEC that is accelerated with temperature does not allow use of these parts in space electronics. Instead, for systems requiring large value capacitors and high operating voltages, designers must use banks of TECs that increases substantially the size and weight of electronic modules.
Development of hermetically sealed AECs might be beneficial for space systems provided the necessary reliability is assured. Increase in leakage current during storage of AEC is well known and is often explained by dissolution of aluminum oxide in electrolyte. However, other possible mechanisms of this effect have not been discussed. Although hermetically sealed TEC have been used in space systems for years, there is a lack of information about the effects of storage on their characteristics that is of great interest as a comparison for aluminum capacitors. This work explores degradation of AC characteristics (capacitance, dissipation factor, and equivalent series resistance) and DC characteristics (leakage and absorption currents) in different types of aluminum and tantalum hermetically sealed capacitors during long-term storage at high temperatures (100 °C, 125 °C, and 150 °C).
It is shown that leakage currents are degrading in both types of capacitors, but this degradation is reversible after bias application. Mechanisms of degradation are discussed, and explanations based on the processes common for both types of capacitors are suggested. Problems associated with assessments of hermeticity and evaporation of the electrolyte in hermetically sealed capacitors are analyzed.
INTRODUCTION
Failures of general-purpose aluminum electrolytic capacitors (AEC) are mostly due to the leak of electrolyte through rubber seals that causes decrease of capacitance and increase of equivalent series resistance (ESR) [1, 2]. Generally, up to 90% of failures of aluminum capacitors are caused by increased internal gas pressure and electrolyte leaks [3]. A commonly used rule-of-thumb is that a capacitor reaches the end of life when it has lost about 40% of electrolyte, resulting in reduction of capacitance by ~10% and increase of ESR approximately 3 times of the initial value [4]. To reduce wear-out failures caused by evaporation of electrolyte, hermetically sealed aluminum electrolytic capacitors have been developed by Cornell Dubilier in 1990th [5].
Life testing showed that these parts can operate reliably at 85 °C for 10,000 hours and development of non-gassing electrolytes allowed for manufacturing of capacitors free of wear-out failures caused by electrolyte loss. Reportedly, hermetic AEC have been successfully used in various aerospace systems. However, the existing requirements for the shelf life (100 hour at 85 °C per MIL-PRF-62G) do not guarantee reliability of the parts after long-term storage and is substantially less than the shelf life even for commercial AEC. The same is true for capacitors manufactured per DLA drawing # 05019 that have operating temperature range from -55 to +125 °C but the shelf life at 125 °C for only 500 hours is guaranteed. This is substantially less than contemporary capacitors manufactured for automotive industry. For example, 192 CTX style aluminum capacitors manufactured by Vishay have 1000 hours shelf life at 125 °C.
Another reason that limits applications of AEC in Hi-Rel systems is degradation of leakage currents during long-term storage of the parts. This degradation is commonly explained by dissolution of aluminum oxide in the electrolyte or by penetration of electrolyte into oxide film [6, 7] that increases with temperature of storage. A reconditioning by applying voltage through a limiting resistor to restore oxide and reduce leakage currents is recommended after long-term storage by manufacturers of aluminum electrolytic capacitors [8]. Development of hermetically sealed AEC can eliminate problems with electrolyte leak, but issues with degradation of leakage currents might still limit application of the parts in space systems.
The first wet tantalum electrolytic capacitors (TEC) that were used in military applications in 1970’s had multiple reliability issues related to hermeticity, dendrite growth, poor performance under mechanical stress testing (vibration), and under reverse bias [9]. These parts were sealed with polymers, and due to electrolyte leakage had a limited operational life of ~ 3 years [10, 11]. Significant efforts have been made to optimize design and materials and improve reliability to the level required for space electronics [9, 12]. Currently, capacitors manufactured per MIL-PRF-39006 that employs double seal design (a glass seal with the welded lead to a tantalum slug that is protected by the case crimping of the Teflon gasket and rubber ring) are among the most robust electronic components and have an extensive history of successful space applications. However, assuring high level of hermeticity and preventing leak failures for new technology single seal tantalum capacitors is more challenging [13].
Wet electrolytic capacitors in space will have excessive internal pressure created by air in the case, electrolyte vapor, and gas generated by electrochemical reactions at the electrodes during operation. This pressure increases substantially with temperature and might grow with time of operation under bias due to excessive leakage currents. To assure integrity of electrolytic capacitors for space systems, a high temperature storage (HTS) testing at 150 °C for 1000 hours was recommended [14]. This test verifies stability of electrical characteristics and the absence of electrolyte leaks thus providing more confidence that the parts will operate reliably during long-term storage and operation in space environments.
The dissociation energy for Ta-O bond (805 kJ/mol) is much greater than for Al-O (512 kJ/mol) so in general, tantalum anodic oxides should be more stable compared to aluminum oxides. Likely for this reason, it is assumed that TEC degrade less during long-term storage compared to AEC [6]. However, there is a lack of literature data regarding the effect of HTS on performance of both types of electrolytic capacitors.
In this work, degradation processes in hermetically sealed aluminum and tantalum electrolytic capacitors during HTS have been analyzed. For this purpose, AC characteristic (capacitance, DF, and ESR) and DC characteristic (leakage and absorption currents) of different types of AEC and TEC were monitored in the process of storage at temperatures of 100 °C, 125 °C, and 150 °C. Hermeticity of the parts was evaluated by standard helium leak testing and by mass measurements during of HTS. Possible mechanisms of degradation of leakage currents and measures to assure hermeticity of the parts are discussed.
EXPERIMENT
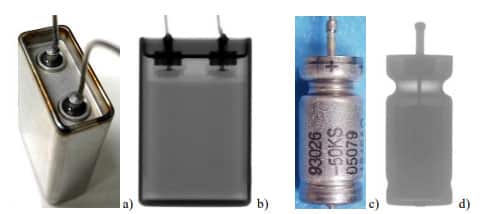
Different types of cylinder case tantalum and four types of flat case aluminum hermetically sealed capacitors were used in this study (see Fig.1). Capacitors were characterized by frequency dependencies of capacitance and ESR and by monitoring polarization leakage currents for one hour at rated voltages followed by depolarization currents at zero volt to assess absorption currents. Electrical measurements were repeated periodically during HTS. From 5 to 10 capacitors were used in each group. Hermeticity leak testing was carried out using High Sensitivity Helium Leak Detection (HSHLD) technique per MIL-STD-750/TM 1071/H3 at a bombing pressure of 75 psia for 6 hours and dwell time of 1 hour. The volume of cases for TEC was ~2 cc, and ~12 cc for AEC. Assessments showed that the internal volume available for helium sorption did not exceed 0.4 cc for both types of capacitors. According to MIL-STD-202, TM114, the reject limit for these cases is 5E-8 atm-cc/sec He.

CHARACTERISTICS OF CAPACITORS
Capacitance and dissipation factors (DF) in electrolytic capacitors are specified at a frequency f = 120 Hz. In some specifications, ESR instead of DF is specified also at 120 Hz. Note, that DF can be calculated based on ESR and capacitance (C) as DF = ESR×2πf×C. For some types of capacitors, high-frequency ESR values are specified at 10 kHz or 20 kHz.
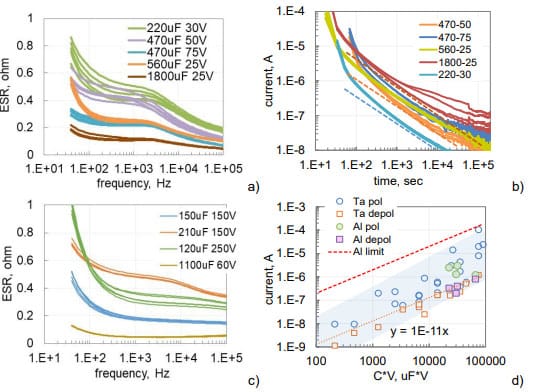
Frequency dependencies of ESR for capacitors used in this study are shown in Fig.2. Both types of capacitors have similar dependencies decreasing from hundreds to dozens of milliohms as frequency increases from 40 Hz to 100 kHz. Note, that low-frequency values of ESR depend on characteristics of the dielectric, whereas high-frequency values depend mostly on the resistivity of electrolyte.
The specified leakage currents in electrolytic capacitors are measured after 5 min of electrification at rated voltages. Analysis shows that these currents are mostly due to absorption processes in the dielectric and change linearly with voltage and the value of capacitance [14] allowing presenting requirements for maximum leakage current as DCL = a×C×VR, where a is a constant and VR is the voltage rating. For AEC, a = 0.002 mA/mF_V. Similar calculations can be also made for TEC [14].
Leakage currents are decreasing with time after voltage application due to polarization processes (see Fig. 2b). If after some time of polarization, a capacitor is short circuited through an ampere-meter, depolarization currents would flow in the opposite direction (dashed lines in Fig.2b). These currents are decreasing with time according to the Curie-von-Schweidler law, I ~ t-n, where n is close to 1. The higher the level of intrinsic leakage currents, the greater is the difference between polarization and depolarization currents. A close correlation between polarization and depolarization currents measured after 1000 sec is typically observed in high quality tantalum capacitors (see Fig. 2b). Absorption currents are reproducible from sample to sample even for lots with a large spread of intrinsic leakage currents caused by the presence of defects.
As evident from Fig. 2d, leakage currents in tested hermetically sealed AEC are within the range of currents measured for military grade tantalum capacitors. On average, depolarization or absorption currents for AEC and TEC are 5 to 10 times below the leakage currents.

DEGRADATION OF TANTALUM CAPACITORS DURING HTS
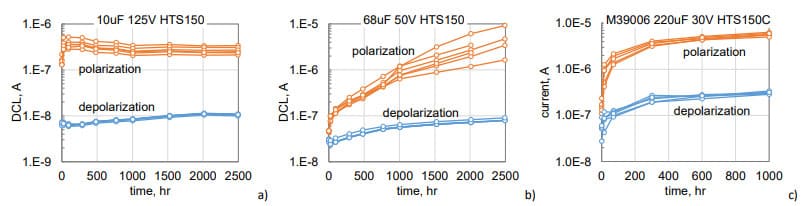
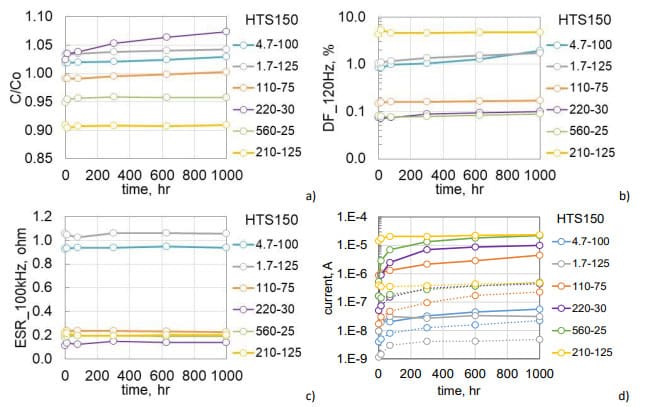
Variations of leakage currents measured after 1000 sec of polarization or depolarization during high temperature storage at 150 °C (HTS150) in three types of tantalum capacitors are shown in Fig.3. These currents are increasing with time with a relatively small spread of data. Polarization currents for different part types are increasing on average in 1.5, 80, and 50 times, whereas depolarization currents are rising from 20% to 5 times. The rate of current increase reduces with time and currents are stabilizing for 10 mF 125 V and 220 mF 30 V capacitors by 1000 hours of storage. Measurements show that HTS resulted in relatively small variations of AC characteristics: capacitance decreased by less than 5%, DF increases less than 20%, and ESR measured at 100 kHz changed less than 4%.

Average values of AC and DC characteristics measured during 1000 hours of HTS150 for six other types of TEC are shown in Fig.4. The results confirm that AC characteristics of the parts remain relatively stable, and their variations on average did not exceed 5% for C and ESR and 40% for DF. Polarization currents increased on average 22 times, but the spread of this increase for different part types was large, from 2 to 60 times. Variations of depolarization currents were less significant, changing from 20% to 10 times. In all cases, leakage currents stabilized after 600 hours of storage.

DEGRADATION OF ALUMINUM CAPACITORS DURING HTS
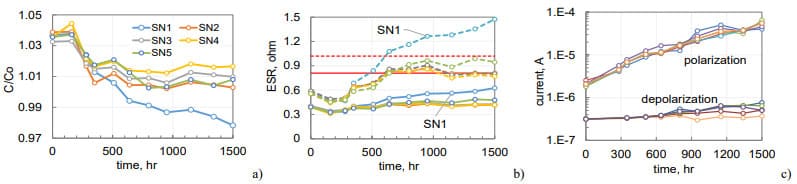
Five samples of 210 mF 150 V hermetically sealed AEC were stored at 150 °C for 1500 hours. Before HTS, these parts successfully passed step stress highly accelerated life testing (HALT) at 125 °C and voltages incrementally increasing from 150 V to 250 V. Duration of each step was 200 hours and total duration of biased testing at 125 °C before HTS150 was 1000 hours. As a result of HALT, polarization leakage currents at room temperature decreased from 2 mA to 0.6 mA while depolarization currents remained at the level of ~0.4 mA.
Capacitance in all samples except for SN1 decreased by ~3% and ESR increased by 50% at 120 Hz and by ~20% at 20 kHz (see Fig.5a, b). Sample SN1 had more than 5% decrease in capacitance and 2.5 times increase of ESR at 120 Hz and exceeded the specified limits. These anomalies were due to hermeticity failure that occurred during preliminary stress testing as will be discussed in the hermeticity section of the paper. In spite of the hermeticity failure, SN1 had leakage currents similar to other samples that increased during HTS in 40 times (see Fig.5c). By the end of testing, leakage currents marginally exceeded the specified limit of 63 mA. Depolarization currents increased less than two times. It is possible that although characteristics of the parts before HTS were normal, behavior during HTS150 was affected by the step stress HALT that could degrade dielectric and electrolyte.

Twenty five samples of 120 mF 250 V aluminum capacitors manufactured in 2021 (lot 1) were split after life testing in two groups for HTS125 (17 samples) and HTS150 (9 samples). The pre-HTS life testing during 1000 hours at 125 °C and 250 V did not result in failures or parametric degradation in the parts. Median values of leakage currents at room temperature reduced from 2.5 mA initially to 1 mA after the testing, and during life testing at 125 °C, the currents reduced from 8.5 mA to 2.3 mA. This behavior can be explained by self-healing of the defective sites in the dielectric or by the charge trapping as will be discussed below.
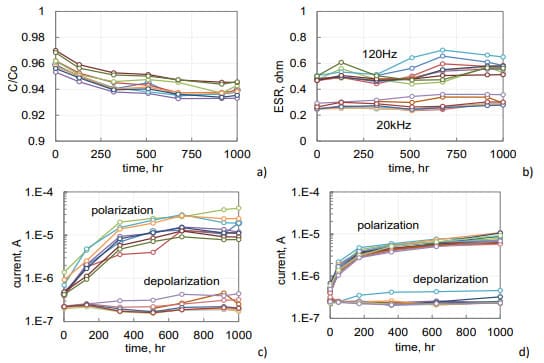
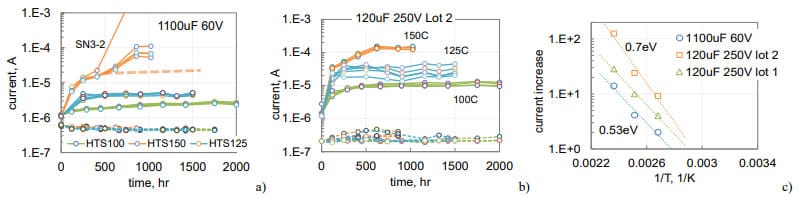
Variations of AC characteristics during HTS150 are shown in Fig.6 a, b. At the end of the test, capacitance decreased by ~2% and ESR increased by ~ 18% at 120 Hz and 14% at 20 kHz. Respectively, DF at 120 Hz increased by 16%. Measurements of AC characteristics during HTS125 resulted in even smaller changes: capacitance decreased by 1.3% and DF increased by 7%. ESR at 20 kHz remained paractically unchanged. On average, leakage currents increased 25 times after HTS150 (see Fig. 6c) and 15 times after HTS125 (Fig.6d). Polarization currents are stabilizing after ~600 hours of storage, and depolarization currents remained stable at both test conditions.

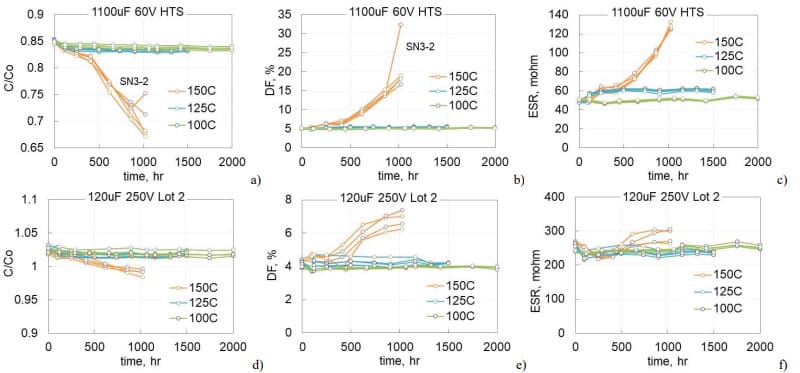
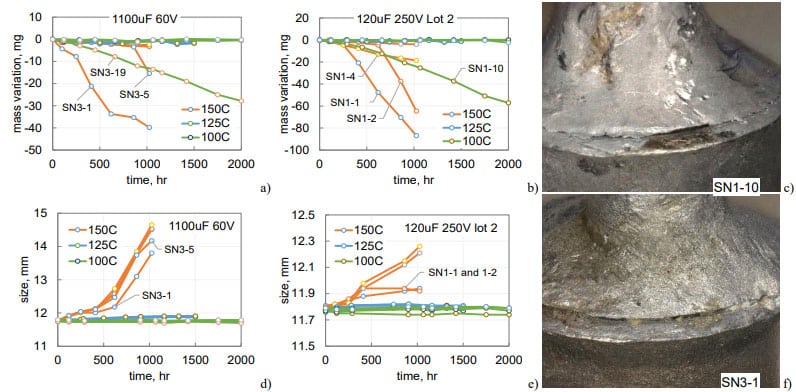
To assess the effect of temperature, different groups of 1100 mF 60 V and 120 mF 250 V capacitors that were manufactured in 2022 (lot 2) were aged at 100, 125, and 150 °C. Each group had 5 samples. Variations of the normalized capacitance and DF at 120 Hz and ESR at 20 kHz are shown in Fig.7. In both types of capacitors, AC characteristics did not change significantly during 2000 hours at 100 °C and 1500 hours at 125 °C, but degradation at 150 °C was noticeable. For 1100 mF 60 V capacitors degradation started after 400 hours of storage and by 1000 hours capacitance decreases on average by 17%, DF increased almost 4 times, and ESR more than two times. Degradation of 120 mF 250 V lot 2 capacitors during HTS150 was less significant, but detectable in comparison with results of HTS100 and HTS125. Similar to lot 1 (Fig.6), capacitance decreased less than 3%, DF increased by 75%, and ESR by less than 10%.

Variations of polarization and depolarization currents during HTS for these parts are shown in Fig. 8. Similar to what was observed before (Fig.6), polarization leakage currents are stabilizing with time and increasing compared to the initial level from 2 times for 1100 mF 60 V parts at 100 °C to 125 times for 120 mF 250 V capacitors at 150 °C. Depolarization currents are changing substantially less: decreasing by ~ 30% for 1100 mF 60 V capacitors and increasing less than two times for 120 mF 250 V capacitors.
Currents in 1100 mF 60 V capacitors during HTS150 appeared to stabilize by 400 hours, but then continued increasing with time (Fig.8a). This behavior coinsides with increased bulging of the cases and will be discussed in the next section of the paper. The ratio between stabilized and initial currents increases exponentially with temperaturte as shown in Fig.8c. This rize corresponds to the effective activation energies in the range from 0.53 to 0.7 eV. Assuming exponential dependence, the increase of currents at lower temperatures can be estimated. For example, for the parts shown in Fig. 8c currents at 65 °C would rise less than 50%.

HERMETICITY OF ELECTROLYTIC CAPACITORS
Various types of hermetic tantalum and aluminum electrolytic capacitors were tested for hermeticity using combined helium and oxygen leak detectors according to MIL-STD-883 Method 1014. Also, the mass of samples was measured periodically over the course of HTS to assess mass losses in case of gross leaks.
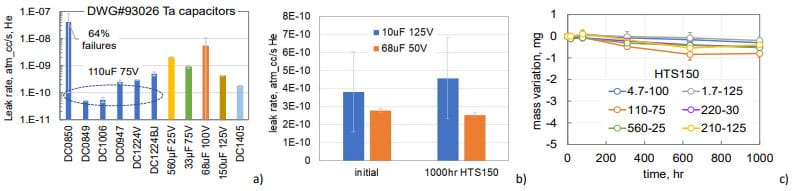
Leak testing of 95 samples of DLA DWG#93026 style TECs from 32 different part types and lot date codes carried out during last 10 years showed that only in one case the leak rate exceeded marginally the limit of 5E-8 atm-cc/sec He with majority of the parts passing the test at the rate almost two orders of magnitude below the limit (see Fig.9a). TEC can sustain 1000 hours of HTS150 without degradation of hermeticity (see an example in Fig.9b), and losses of the electrolyte after 1000 hours of HTS150 did not exceed 1 mg (Fig.9c).

Results of hermeticity measurements for 120 mF 250 V (lot 1) AEC in the process of testing before HTS are shown in Fig.10a. One out of 28 tested samples, SN11, had acceptable leak rate initially but failed after 10 temperature cycles between -55 and +125 °C. Another sample, SN28, had an excessive leak rate initially, apparently recovered after temperature cycling, but failed again during the following tests (burn-in at 85 °C and 250 V for 96 hours and life test at 125 °C and 250 V for 1000 hours). All samples had more than an order of magnitude decrease in leak rates after life testing, which was likely due to a different test condition (72 hours dwell time compared to 1-3 hours before).
Visual examinations revealed a crack in the seal of SN28 (Fig.10b), but no defects were observed in SN11. Mass measurements showed that after 400 hours of HTS150 SN28 lost 17.6 mg, whereas SN11 lost only 2.6 mg. All electrical characteristics for both samples remained normal.

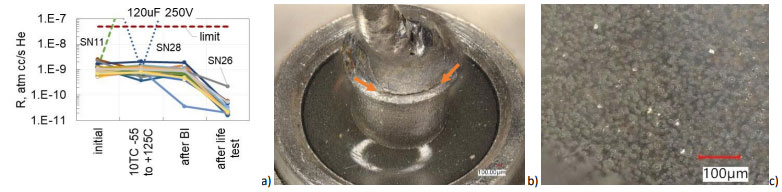
Optical examinations revealed multiple bubbles in the glass (Fig.10c). Helium sorption in the glass and/or in these bubbles can cause excessive desorption of He during leak testing thus masking actual leak rate and resulting in false failures. A similar effect was reported in [15] where surface desorption from the glass feedthroughs resulted in false hermeticity failures of hybrid microcircuits.
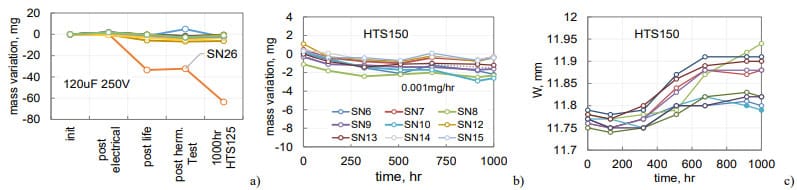
Fig. 11a shows mass variations in the process of testing before HTS for the same parts as in Fig.10a. Note that sample SN26 that had acceptable He leak rate lost 35 mg of electrolyte after life testing at 125 °C and 30 mg more after 1000 hours of HTS125. Other samples in this group lost less than 3 mg of electrolyte after life test and HTS125. All parts, including SN26, had normal electrical characteristics. Visual examinations revealed a crack between solder and the tube similar to the one shown in Fig.10b. Apparently, passing helium leak testing does not guarantee hermeticity of the parts. Also, hermeticity can be compromised during operations or exposure to high temperatures that creates excessive internal pressure in the case.
HTS150 testing using samples from the same lot of capacitors resulted in less than 3 mg losses after 1000 hours of storage (see Fig.11b). Variations of the case sizes (width) indicate that bulging caused by high internal pressure did not exceed 0.15 mm or 1.3% of the width (Fig.11c). Results indicate that normal quality hermetic AEC can withstand 1000 hours storage at 150 °C.

Variations of the hermeticity leak rates for 5 samples of 210 mF 150 V capacitors during pre-HTS150 tests are shown in Fig. 12a. These tests included 168 hours HTS125 and 200 hours HALT at 125 °C and 200 V followed by 200 hours of HALT at 250 V. No electrical or hermeticity failures during or after HALT were observed.

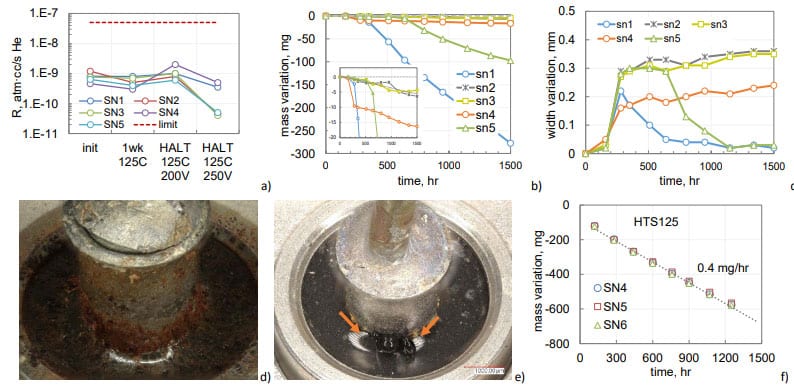
Weight measurements during HTS150 showed a substantial mass reduction in SN1 after 200 hours and in SN5 after 500 hours (Fig.12b). Eventually, after 1500 hours, SN1 lost 277 mg and SN5 97 mg. Mass losses in other samples were substantially less. Results of the width measurements of the cases are shown in Fig.12c. A noticeable bulging, up to 0.3 mm occurred after 200 hours of storage. Reduction of the width in SN1 and SN5 after 200 and 600 hours of HTS was due to a pressure relief caused by cracks in the seals. Sample SN1 had a large crack between the solder and the tube (Fig. 12d), and SN5 had a crack between the tube and glass seal (Fig.12e).
For comparison, mass losses in non-hermetic 150 mF 150 V AEC during HTS125 are shown in Fig.12f. In non-hermetic parts, the electrolyte leaked at the rate of 0.4 mg/hr, which is 400 times greater than the rate of mass losses in normal quality hermetic 210 mF 150 V capacitors during HTS150 (0.001 mg/hr). Note, that similar to hermetic parts, all electrical characteristics of non-hermetic capacitors remained within the specified limits even after they lost 600 mg of electrolyte.
Variations of mass and width of cases for 1100 mF 60 V and lot 2 of 120 mF 250 V capacitors during HTS at three temperatures are shown in Fig.13. One out of 5 samples in each group had noticeable electrolyte leak even at 100 °C. These leaks resulted in linear mass decrease from the beginning of the test indicating that the cracks were present in the parts initially. Substantial mass losses during HTS150 occurred in two out of five samples in the first group and three out of five samples in the second group.
In most cases, the leak of electrolyte was due to cracks between the tube and solder that were observed during initial examinations of the parts (see Fig.13c, f). However, cracks at the tube-solder and tube-glass interfaces in SN1-1 and SN1-2 of 120 mF 250 V capacitors were observed only after 250 hours of HTS150. Based on results for five samples tested at 125 °C no noticeable electrolyte leaks were observed, so the proportion of parts with defects is ~7 and 14% for the two types of capacitors shown in Fig.13.
All samples that were stored at 150 °C had noticeable bulging (see Fig.13d, e). In 1100 mF 60 V capacitors the bulging started after 400 hours and exceeded 2 mm by 1000 hours. The increase of the width for 120 mF 250 V capacitors was substantially less, below 0.4 mm. All samples with substantial mass losses had somewhat smaller bulging that was due to the pressure relief in the case.

The pressure of the electrolyte vapor (typically 40% H2SO4) in tantalum capacitors increases from approximately 0.7 atm at 100 °C to 1.76 atm at 125 °C and 3.84 atm at 150 °C [13]. For aluminum capacitors that employ high boiling temperature electrolytes based on ethylene glycol with the boiling temperature Tb= 197 °C or γ-butyrolactone with Tb= 204 °C, the pressure remains below 1 atm even at 150 °C. In this regard, robustness of AECs at high temperatures should be greater than for TECs. However, presence of water in the electrolytes of AEC might increase internal pressure substantially and cause degradation of hermeticity with time during HTS.
Analysis shows that overall, hermeticity of tantalum capacitors during HTS is better than for aluminum capacitors. Considering that in most cases hermeticity failures of AECs were due to cracks between solder and feedthrough tubes, welding of the leads to the feedthrough used in TECs assures a more reliable hermeticity of the parts.
DISCUSSION
AC characteristics after 2000 hours of HTS100 and 1500 hours of HTS125 in aluminum and tantalum capacitors remained within the specified limits. The same is true for 1000 hours testing at 150 °C except for 1100 mF 60 V aluminum capacitors. In all tested parts (except for 1100 mF 60 V at HTS150) AC characteristics during HTS did not change significantly: capacitance decreased by a few percent only and ESR increased less than 20%.
Decreasing of capacitance and increasing of ESR during storage of non-hermetic AEC was reported by various authors [2, 4, 16, 17]. The rate of degradation was increasing with temperature, and according to [17], the activation energies of the degradation rate is in the range from 0.69 to 0.77 eV. This degradation is often explained by evaporation of electrolyte or dissolution of the oxide. However, in hermetically sealed capacitors evaporation of the electrolyte in most cases is negligible. Dissolution of the oxide should lead to decreasing of the oxide thikckness thus increasing capacitance which is not consistent with the experimental data.
One of the first works explaining increasing leakage currents during HTS in AEC by dissolution of oxide was published in 1964 by Alwitt and Hills [18]. The authors observed increasing of capacitoance and decreasing of mass of the foil after heating samples of commercial etched aluminum foils in glycol-borate electrolyte at 85 °C. Although mass losses were attributed to dissolution of the aluminum oxide dielectric, a corrosion attack of the anode foil at the grain boundaries was also detected. This process was associated with gas (most likaly hydrogen) evolution caused by galvanic corrosion.
A substantial bulging of the cases for 1100 mF 60 V capacitors after 400 hours of HTS150 was likely also caused by galvanic corrosion of aluminum foils. A substantial difference in galvanic potentials between aluminum and stainless steel case might be a factor contributing to the corrosion process. However, the absence of significant bulging in three other types of AEC that employ the same cases indicates that this is not the major factor for corrosion. Most likely, corrosion was due to the presence of contaminations in the foil. The associated decrease of the effective surface of electrodes and changes in the electrolyte composition might explain a decrease of capacitance (more than 20%) and increase of ESR (~2.5 times). Variations in the composition of electrolyte might be also due to reactions with aluminum oxide at hight temperatures [19]. Thermal decomposition of γ-butyrolactone might cause generation of carbon oxides and bulging of the cases, but this process requires temperatures above 400 °C [20, 21].
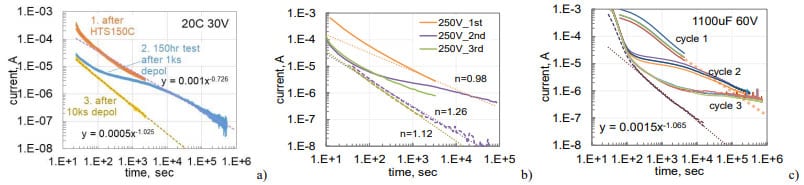
To get a better understanding of the increasing leakage currents during HTS and their recovery after voltage application, relaxation of currents in AEC and TEC after HTS was recorded during three consequtive polarization/depolarization cycles. The first cycle consisted of polarization for 1 hour at the rated voltage followed by depolarization also for one hour. During the second cycle, polarization continued for 10 to 20 hours followed by 3-hour depolarization. The last cycle was similar to the first one. Results of these measurements are similar in all cases and show that depolarization currents remain practically the same for the three cycles (Fig.14). As expected, polarization currents decreased substantially in cycles 2 and 3 compared to cycle 1 (so-called reforming process). However, this decrease occurs mostly during a period close to the duration of the initial polarization. After that, the currents decreased similar to what is expected if the first polarization would continue (shown with dotted lines).

Leakage currents in electrolytic capacitors are exponentizally increasing with the square root of voltage and for different ranges of temperature and voltage were explained either by the surface barrier limited Schottky conduction or Poole-Frenkel conduction through the shallow traps in the bulk of the oxide [14]. Electrons in the electrolyte that are considered a major charge carriers in oxides are formed in the Helmholtz double layer at the electrolyte/oxide interface [22].
Anodic aluminum oxide can be presented as a wide band gap (likely more than 5 eV) dielectric with a large amount of electron traps [23] that control electrical conduction [24]. The band gap for anodic Ta2O5 dielectrics is also large, in the range from 4 to 4.4 eV [25, 26]. Current relaxation for these dielectrics can be explained based on the presence of deep traps in the anodic tantalum or aluminum oxides (see Fig.15). Charging of the traps during operation under bias causes a gradual increase of the barrier height FB at the electrolyte/oxide interface resulting in decreasing of leakage currents. During unbiased storage, deep traps are gradually discharging thus decreasing the barrier to . The following voltage application resuls in high initial currents and increased rate of electron trapping processes. Accumulation of negative charges close to the electrolyte/oxide interface increases the barrier and decreases leakage currents.
Absorption currents can be explained by electron trapping at the surface states during polarization and freeing during depolarization processes. These currents are increasing during HTS up to an order of magnitude for tantalum and to a lesser degree, up to two times, for aluminum capacitors. This increase is likely due to a generation of surface traps during HTS. The difference between TEC and AEC might be due to a smaller initial concentration of the surface traps in tantalum capacitors (absorption capacitance Ct ~ 12% of the nominal capacitoance [14]) compared to aluminum capacitors that have Ct is in the range from 15 to 25% for different part types but does not change significantly through HTS.

CONCLUSION
- Hermetically sealed tantalum and aluminum capacitors have similar frequency dependencies of ESR and similar levels of polarization and depolarization currents that are controlled by the charge absorption processes.
- Degradation in all tested lots of AEC and TEC during high temperature storage at 150 °C for 1000 hours, except for 1100 mF 60 V aluminum capacitors, resulted in a few percent decrease of capacitance and less than 20% increase of ESR indicating a relatively small changes in the conductivity of electrolyte.
- AC characteristics in 1100 mF 60 V aluminum capacitors did not change significantly during 1500 hours of at 125 °C or 2000 hours at 100 °C but degraded above the specified limits after 400 hours at 150 °C. This degradation was associated with substantial bulging of the cases thus indicating gas generation due to possible galvanic corrosion of aluminum foils.
- Hermeticity testing using helium testers might result in false gross leaks of AEC caused by excessive helium sorption in the sealing glass. Hermeticity of electrolytic capacitors can be compromised with time of HTS due to excessive pressure of the electrolyte vapor and/or gas generation caused by galvanic corrosion or excessive leakage currents. For this reason, measurements of mass losses after HTS can assure a more reliable assessment of the hermeticity. Normal quality parts after 1000 hours at 150 °C are losing less than 0.1% (~3 mg) of the initial mass of capacitors. Welding of the leads to the feedthrough in TEC assures a more reliable hermeticity compared to soldering of the leads in AEC that might have cracks between the tube and solder.
- Leakage currents during HTS are stabilizing in both types of capacitors after a few hundred hours of storage in the range of temperatures from 100 to 150 °C. Stabilized levels of currents are increasing exponentially with temperature and the effective activation energy of this increase is in the range from 0.53 to 0.7 eV. The process of current degradation can be explained based on the Schottky mechanism of conduction with the barrier height changing by charge trapping/releasing in the deep states of the oxides. Gradual trapping of electrons during long-term polarization increases the barrier thus decreasing currents, while freeing from the traps during HTS reduces the barrier resulting in increased initial levels of currents after HTS.
ACKNOWLEDGMENT
The author is thankful to Lyudmyla Panashchenko Ochs, NASA GSFC, EEE Parts, Photonics and Assembly Branch for a review and discussions, to Peter Majewicz, NEPP program manager, for support of this study, and to Linda Del Castillo, JPL, for providing samples and results of DPA. This work could not have been done without help of the NASA GSFC Parts Analysis Lab specialists.
REFERENCES
[1] J. R. Celaya, C. Kulkarni, S. Saha, et al., “Accelerated aging in electrolytic capacitors for prognostics,” in Reliability and Maintainability Symposium (RAMS), 2012 Proceedings – Annual, 2012, 23-26 Jan. 2012, pp. 1-6.
[2] G. Caswell, “Can Electrolytic Capacitors Meet the Demands of High Reliability Applications?,” in 22nd European Microelectronics and Packaging Conference & Exhibition (EMPC), Pisa, Italy, 2019, 2019, pp. 1-5.
[3] A. Riz, D. Fodor, O. Klug, et al., “Inner gas pressure measurement based life-span estimation of electrolytic capacitors,” in Power Electronics and Motion Control Conference, 2008. EPE-PEMC 2008. 13th, 2008, 1-3 Sept. 2008, pp. 2096-2101.
[4] O. P. Y. Anunay Gupta, Douglas DeVoto, Joshua Major, “A Review of Degradation Behavior and Modeling of Capacitors,” presented at the American Society of Mechanical Engineers (ASME) 2018 International Technical Conference and Exhibition on Packaging and Integration of Electronic and Photonic Microsystems (InterPACK 2018), San Francisco, California, 2018.
[5] L. L. Macomber and W. Elias, “Long-life, high-voltage, hermetically sealed aluminum electrolytic capacitors,” presented at the 16th Capacitor And Resistor Technology Symposlum (CARTS 96), 1996.
[6] EPCI. (2022). Shelf Life and Storage of Capacitors. Available: https://passive-components.eu/get-the-lowdown-on-shelf-life-and-storage-of-capacitors/
[7] F. Puhane, “Afraid of aging? The effects of time on electrolytic capacitors.,” vol. SN019: Wurth Elektronik Support note, 2021, www.we-online.de.
[8] C. Hillman. Long-Term Storage of Aluminum Electrolytic Capacitors. Available: www.dfrsolutions.com/hubfs/DfR…/Long-Term-Storage-of-Al-E-Capacitors1.pdf
[9] A. Holladay, “History of the CLR79 all-tantalum wet slug electrolytic capacitor,” in 10th Capacitors and Resistors Technology Symposium, 1990, pp. 5-8.
[10] W. M. Rowe and P. H. Eisenberg, “Factors Affecting the Reliability of Wet Tantalum Capacitors,” in Reliability Physics Symposium, 1967. Sixth Annual, 1967, Nov. 1967, pp. 243-255.
[11] D. Hayward, “Failure mechanisms in wet tantalum capacitors,” Electrocomponent Science and Technology, vol. 2, pp. 249-257, 1976 http://dx.doi.org/10.1155/APEC.2.249
[12] Difott, “Product Evaluation of MIL-C-390006/22 Nonsolid Electrolyte Tantalum Capacitors-Determination of the Performance of These Capacitors When Exposed to Vibration Environments,” in 5th Capacitors and Resistors Technology Symposium, San Diego, CA, 1985, 11-14 March, pp. 133-140.
[13] A. Teverovsky, “Deformation of Cases in High Capacitance Value Wet Tantalum Capacitors under Environmental Stresses,” NASA/GSFC, Greenbelt, MD 2016, https://ntrs.nasa.gov/search.jsp?R=20160014329
[14] A. Teverovsky, “Leakage currents and gas generation in advanced wet tantalum capacitors,” NASA/GSFC, Greenbelt, MD 2015, https://nepp.nasa.gov/…/2015-562-Teverovsky-Final-Paper-NEPPweb-TN2…
[15] P. McManus, K. Pressnell and L. Panashchenk, “NEPP Program Task 13-294: Hermeticity Correlation Study,” presented at the Electronic Technology Workshop, Greenbelt, MD, 2013. https://nepp.nasa.gov/workshops/etw2013/talks/Tue_June11_2013/1630_McManus_Pressnell_Hermeticity%20Leak%20Testing.pdf
[16] X. Wang, R. Tallam, A. Shrivastava, et al., “Reliability Test Setup for Liquid Aluminum Electrolytic Capacitor Testing,” in 2019 Annual Reliability and Maintainability Symposium (RAMS), 2019, 28-31 Jan. 2019, pp. 1-5.
[17] B. Sun, X. Fan, C. A. Yuan, et al., “A degradation model of aluminum electrolytic capacitors for LED drivers,” in 16th International Conference on Thermal, Mechanical and Multi-Physics Simulation and Experiments in Microelectronics and Microsystems (EuroSimE 2015), Budapest, 2015, April 20-22, pp. 1-4.
[18] R. S. Alwitt and R. G. Hills, “The Chemistry of Failure of Aluminum Electrolytic Capacitors,” in Physics of Failure in Electronics, 1964. Third Annual Symposium on the, 1964, Sept. 1964, pp. 93-107.
[19] I. Száraz and W. Forsling, “Interaction between a Capacitor Electrolyte and γ-Aluminum Oxide Studied by Fourier Transform Infrared Spectroscopy,” Applied spectroscopy, vol. 57, pp. 622-627, 2003
[20] Z.-H. Li, W.-N. Wang, K.-N. Fan, et al., “Ab initio study on thermal decomposition of γ-butyrolactone,” Chemical Physics Letters, vol. 305, pp. 474-482, 1999/05/28/ 1999 https://www.sciencedirect.com/science/article/pii/S0009261499003978
[21] S. Yamamoto, M. Suzuki, Y. Sueishi, et al., “Thermal and infrared multiphonon decomposition of gamma-butyrolactone in the vaper phase,” Bulletin of the Chemical Society of Japan, vol. 65, pp. 3112-3117, Nov 1992 <Go to ISI>://WOS:A1992JZ90200033
[22] V. G. Bordo and T. Ebel, “First-principles theory of electrical breakdown in barrier anodic films in contact with an electrolyte,” Electrochimica Acta, vol. 354, p. 136490, 2020/09/10/ 2020 https://www.sciencedirect.com/science/article/pii/S0013468620308835
[23] E. Hourdakis and A. G. Nassiopoulou, “Charge-trapping MOS memory structure using anodic alumina charging medium,” Microelectronic Engineering, vol. 88, pp. 1573-1575, 2011/07/01/ 2011 https://www.sciencedirect.com/science/article/pii/S0167931711002747
[24] M. Mibus, C. Jensen, X. Hu, et al., “Dielectric breakdown and failure of anodic aluminum oxide films for electrowetting systems,” Journal of Applied Physics, vol. 114, p. 014901, 2013 https://aip.scitation.org/doi/abs/10.1063/1.4812395
[25] R. M. Fleming, D. V. Lang, C. D. W. Jones, et al., “Defect dominated charge transport in amorphous Ta2O5 thin films,” Journal of Applied Physics, vol. 88, pp. 850-862, 2000 http://scitation.aip.org/content/aip/journal/jap/88/2/10.1063/1.373747
[26] V. Y.-Q. Zhuo, Y. Jiang, M. H. Li, et al., “Band alignment between Ta2O5 and metals for resistive random access memory electrodes engineering,” Applied Physics Letters, vol. 102, 2013 https://doi.org/10.1063/1.4792274