North American February 2023 electronic component sales sentiment confirms past growth expectations according to ECIA Electronics Components Industry Association Survey.
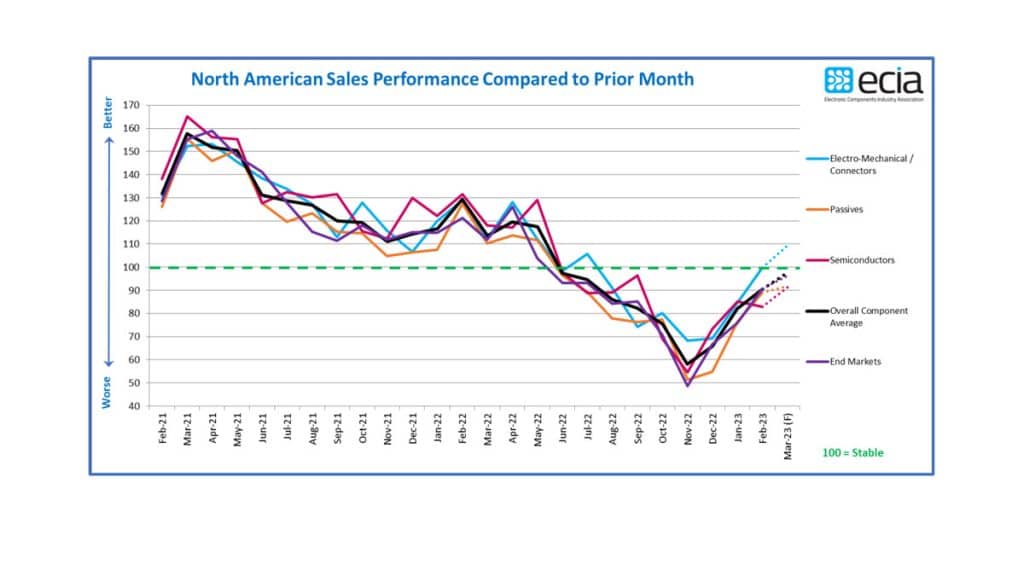
The improving sales sentiment that began in December 2022 continued into February and March as survey results powered beyond expectations in the latest results. Overall average sales sentiment leapt again in February as it increased by 8.4 points from January’s level reaching 90.6 points. This completely outstrips the February forecast from the January survey by 12.7 points. It is also a jump of 39.5 points from the low set in November.
The relatively optimistic outlook carries forward into the March forecast with growth to 97.6, an increase of another 7 points. Electro-Mechanical Components lead the way as
this segment increased to 99.9, nearly hitting the growth threshold of 100. This category is projected to move into solid growth territory in March at 109.5. While Semiconductor sentiment slipped down slightly to 82.9 in February it is projected to regain momentum in March and improve to 91.4.
Electro-Mechanical and Passive components both beat February expectations by double digits with Electro-Mechanical eclipsing its forecast by 17.5 points and Passives overperforming by 13.6 points. Highly impressive results as they sustain strong momentum in the first two months of 2023. Passive components and Semiconductors are forecast to both top 90 in March at 91.7 and 91.4 respectively. Across the board, all three categories deliver very encouraging sales sentiment results.
Keeping pace with the strong improvement in the component index, the Overall End-Market index surpassed expectations in February by 12.7 points as it rose to 90.7. Again, expectations for March continue to improve as the outlook is for 96.3 in the coming month. Every individual end-market measures delivered a solid to strong improvement in sales sentiment in February.
Three end-market sentiment measurements came in above the 100 threshold in February with Avionics/Military/Space, Automotive, and Industrial reaching 125.6, 108.7, and 103.6 respectively. Medical is forecast to join them in the 100+ club in March. A sense of optimism in sales sentiment has grown in all areas as most segments move closer to the 100 level with a few passing this threshold.
Measures above 100 reflect expectations of improved month-to-month sales. The recovery of sales sentiment scores for components and markets supports a soft-landing scenario in the market that has been hoped for by most electronics component supply chain participants.
The positive news for electronic component sales sentiment is reinforced by the results of the Q1 2023 ECST survey. This longer-term view reports optimism for improving sales in Q2. In Q1 the survey results show 33% of participants expect declining sales while 27% see improving sales. This is reversed in the Q2 outlook with 32% anticipating sales growth and 28% projecting declining sales. Growth expectations in Semiconductors and Electro-Mechanical/Connectors are very strong compared to declining expectations in Q2.
Only Passives remain underwater with a larger share expecting a sales decline in Q2. The Connectors and Analog/Linear IC segments report the greatest optimism in Q1 while Memory ICs and Resistors show the greatest pessimism. Looking toward Q2 the survey results show MCU/MPU, Analog/Linear IC, Discrete and Connector segments with the highest level of optimism for sales growth. Memory ICs and Resistors report the deepest overall declining sales sentiment in Q2. Quarterly expectations for end-market growth in Q1 and Q2 mirror the monthly results.
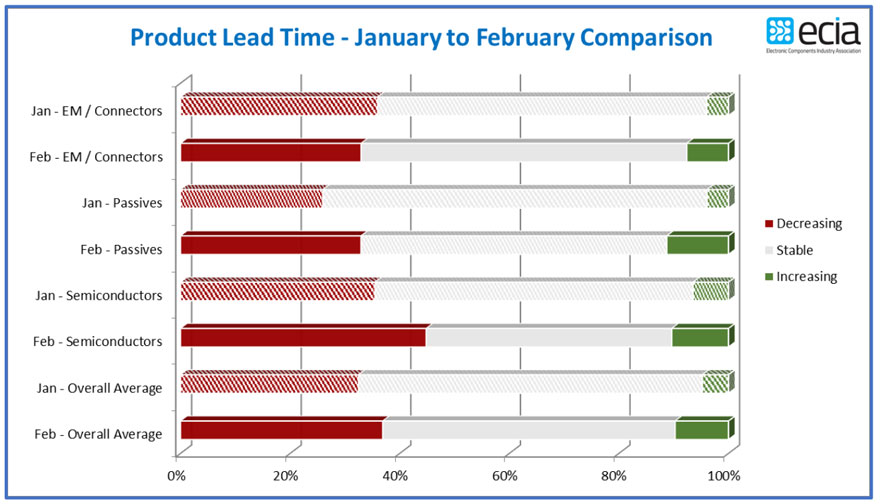
The reported product lead time trends indicate a slight uptick in lead time pressure in February compared to January. This aligns with the improved sales sentiment reports. However, overall February reports of increasing lead times only grew to 10% compared to 5% in January. At the same time, decreasing lead time reports also grew by 5% as they expanded to 37%. Once again, stable lead time pressure dominated most reports at an overall average of 53% in February. Given the overall assessment that inventory overhang is the greatest challenge facing the supply chain currently, product mix issues would appear to be the main contributor to any reports of increasing lead times as
inventories balance out in the declining market.