
2021 passive components market outlook is discussed in next Dennis Zogbi’s, Paumanok Inc. article published by TTI Market Eye.
The overall market outlook for February through December 2021 remains robust due to high dollar value growth opportunities in automotive electronics, telecommunications infrastructure and 5G handsets.
Meanwhile, stable environments in computers, gaming and home theater electronics are also expected to support an overall positive market environment, with growth rates further stimulated by global economies emerging from pandemic into a “revenge economy” – where global economic stimulus packages and technology are continually used to achieve the sustainability goals of the entire global population.
For full-year 2021, expect market drivers for capacitors, resistors and inductors to include:
- 5G infrastructure deployment
- Battery electric vehicle production, automotive telematics and driver-assist technology
- Solid-state drives for cloud storage, higher-performance computing and devices for the Internet of Things
- The August 2021 Olympics in Japan
- Smartphones, desktop and notebook personal computers, and game consoles to support the continuing remote working and learning trends worldwide
Recent reporting out of Asia suggests the global passive components markets experienced a slight contraction in the December quarter of 2020 that largely impacted the MLCC supply chain. MLCC sales in the prior (September 2020) quarter had been much higher than expectations, supporting 5G rollout in China. However, early reporting from Korea and China in January 2021 suggests that the market pulled back in the December 2020 quarter by low single digits. Meanwhile, other product lines – with emphasis on polymer tantalum, aluminum electrolytic and plastic film capacitors – experienced robust sales due to a revival of the automotive supply chain in this quarter.
Based upon full-year forecasts provided by Japanese vendors of passive components, we expect also that demand will grow in the March quarter and remain robust throughout the year. Early data (including vendor financial reporting, lead times (shown below) and ballooning raw material prices) suggests passive component demand is in a growth part of the cycle, similar to that observed by Paumanok Publications, Inc. in CY 2011.
Raw Materials Pricing Update: A Potential “Red Flag”?
The Passive Component Raw Material Pricing Index (which covers feedstock pricing for many of the primary raw materials consumed in the production of passive electronic components) showed a 3.6 percent increase in January 2021 on a month-to-month basis, following similar increases in December 2020.
These price increases continue to impact almost every raw material in the passive component supply chain, an indication of strong demand. A cause for concern is the fact that the last time this threshold was reached, it preceded a steep decline in global market value of both materials and components.
Note that the raw material price index for passive components has increased by 21 percent since September 2020, and in step with increased demand for passive components. Prices for base metals such as nickel, copper, aluminum and zinc all have increased sharply between September 1, 2020 and January 30, 2021, as have the prices for precious and rare metals such as palladium, ruthenium and silver.
This increase in the cost of production for passive components is historically indicative of strong demand. The pricing for passive components has been elevated in conjunction with these increases in materials costs, in direct correlation to demand and the long-lasting impact of shortages of key parts over the past three years.


Impact of Raw Materials by Product Line
While many individual ingredients go into the production of individual passive component lines, the products shown in the materials index are part of the supply chain and are trackable via third-party data sources, which we collectively pool here to form the Pricing Index.

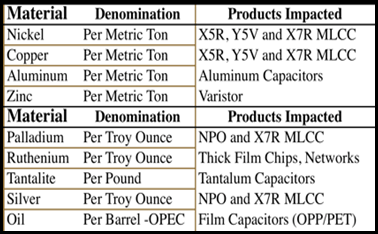
Correlation of Raw Materials with Individual Passive Component Product Lines
Base metals such as nickel and copper are used as the electrode and termination materials in ceramic chip capacitors, while aluminum is used as the anode and cathode material in aluminum electrolytic capacitors. Zinc is the active ingredient in non-linear resistor products, and in metal oxide varistors used for circuit protection in almost all AC line electronics.
In the more exotic materials – including precious metals, rare metals and crude oil – we note that palladium is used in MLCC electrodes and ruthenium is used as the resistive ingredient in film metallization for resistors. This category also includes the tantalite or tantalum ores consumed in tantalum capacitors, as well as the silver consumed in MLCC terminations and SLC electrodes. Crude oil is the feedstock for plastics, consumed in AC film and DC film capacitors.
Ultimately, this index covers materials consumed in more than 90 percent of the total passive component units produced in any given year.
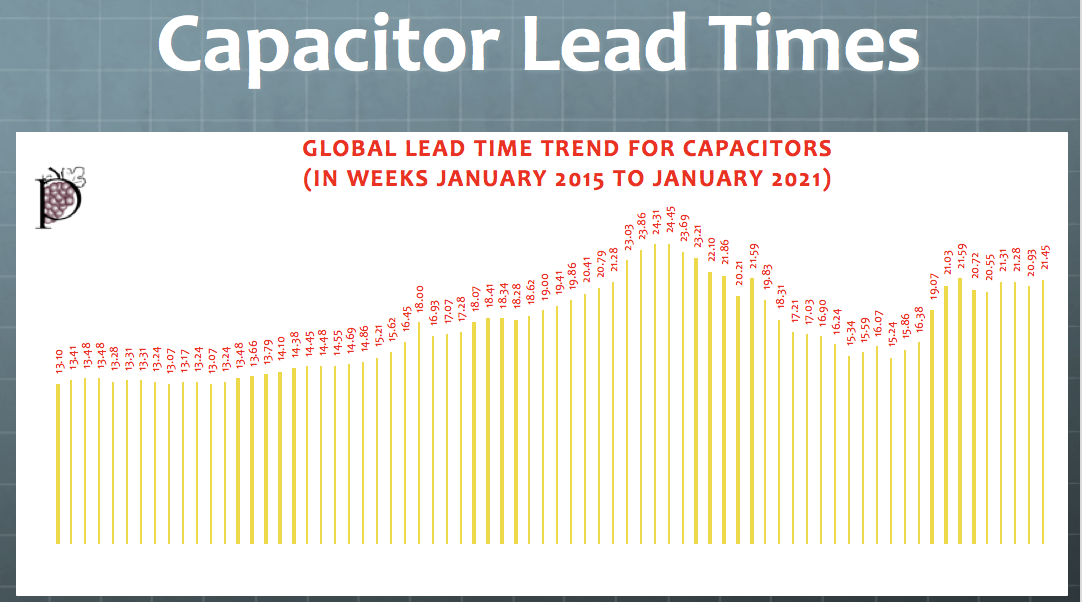
Capacitor Lead Time Trends
In January 2021, the lead times for all capacitors – including MLCCs, plastic film capacitors, and tantalum and aluminum electrolytic capacitors – continued to tighten, as they had also done in December 2020. Note that the tightening of supply is appearing in tantalum, aluminum and film capacitors more than in MLCCs, where the supply concern is greatest.
There is an expectation of strong market demand for passive components for 2021 to support 5G infrastructure and battery-operated vehicle development. Each of these are either high-frequency or high-voltage, requiring a unique suite of products for base station, converter, inverter and/or charger architectures. The following figure clearly shows that, for the month of January 2021, lead times increased slightly on a month-to-month basis for capacitors due to strong demand from electric automotive and telecom infrastructure sectors, while computing and gaming remain at above normal levels of demand to support the global stay-at-home trend.

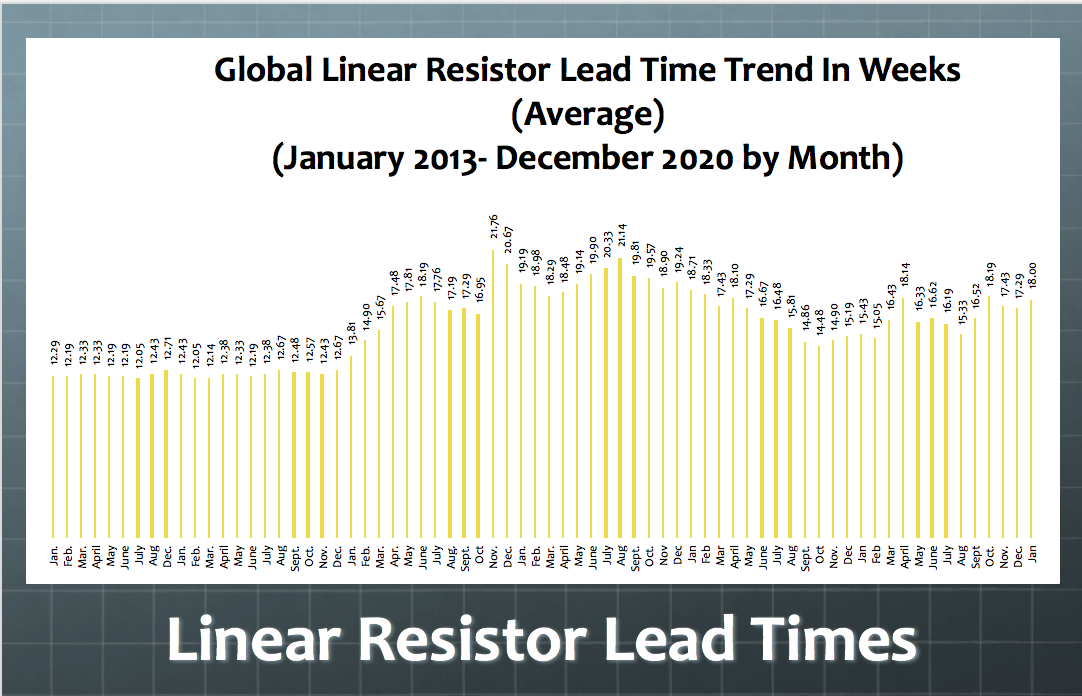
Resistor Lead Times
In January 2021, the resistor markets tightened for resistors, with demand increasing for large case size thick-film chips and thin-film chips. Axial and radial leaded designs and networks showed mixed results for the month. A visual interpretation of the data is presented in the chart below.
The chart shows an increase in lead times for the month of January 2021 as demand for thick- and thin-film chips increased on a month-to-month basis to support telecom infrastructure and automotive electronics demand. Thick-film chip resistors registered a sudden increase in demand in December 2020 on a month-to-month basis for larger chips consumed in high voltage electric vehicles, this trend continued in January 2021. Demand increased for all large case size chip resistors 1206 and above (EIA case sizes in inches) in January 2021.

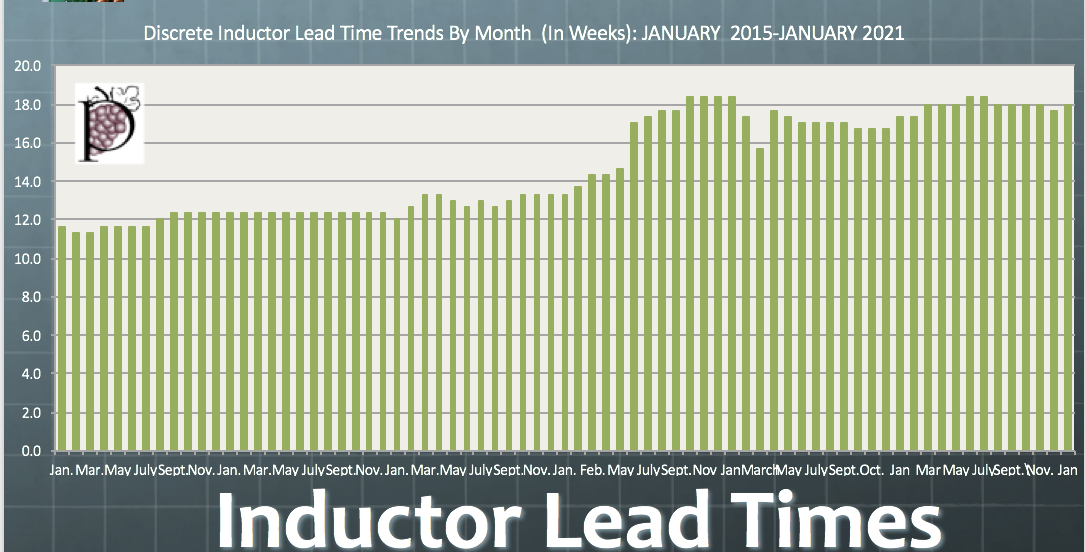
Inductor Lead Times
Discrete inductor demand increased in January 2021 after weakening in December 2020 on a month-to-month basis. In January 2021, increases centered in the axial and radial leaded inductor designs. Overall, inductor markets remain elevated as these are key components in noise suppression. This demand is 5G base-station related, but auto telematics and auto radar circuits are also driving up demand for robust discrete inductors for challenging environments.

Currency Translation
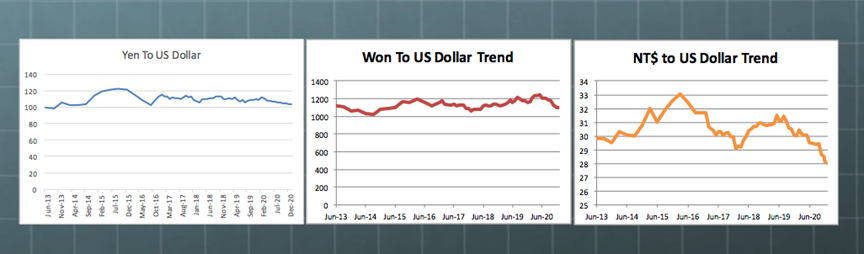
As we have noted, the exchange rates of foreign currencies that define the passive component market index have been having a major impact on vendors that report in U.S. dollars. In January 2021, the global currencies that impact the passive component supply chain all continued to gain strength against the U.S. dollar.
However, the shifts in valuation are not so great as to create any added negative impact on the supply chain, or favor any region in terms of pricing in any meaningful way. In passives, due to recent shortages of MLCCs and related components, pricing has become secondary to availability and higher price norms are now built into the system. The won is notable now in terms of its growth against the U.S. dollar, as is the NT$, but the yen is quite stable.

Summary and Conclusions
The overall market outlook for CY 2021 remains robust due to high dollar value growth opportunities in automotive electronics, telecommunications infrastructure and 5G handsets. Meanwhile, stable environments in computers, gaming and home theatre electronics also are expected to support an overall positive market environment, with growth rates further stimulated by global economies emerging from the pandemic, global economic stimulus packages and technology continually being used to achieve the sustainability goals of the entire global population.
- The raw material price index for passive electronic components increased by another 3.6 percent in January 2021. This clearly breaches our prior thresholds for a global market price correction and is considered a “red flag.”
- Prices for all base metals have increased by 21 percent from September 2020 to January 2021; and pricing for key precious metals consumed in mass-produced passives and palladium and ruthenium are at all-time highs.
- We now estimate that year-over-year demand for passive components through the March 2021 quarter will decline five percent in dollar value, but with high-capacitance MLCCs showing slight growth of about 3 percent while all other product lines slow down and register a year-on-year decline.
- Regardless of this, the outlook for specific markets remains robust for CY 2021. The value of demand for passive components consumed in battery electric vehicles in CY 2021 will increase dramatically and revive old technologies that have had little technical innovation over the past 25 years. (And now, it’s a rush to enhance electrical product lines!)
- The cycle for CY 2021 should mirror that of CY 2011. The data are similar, and the anticipation of a global stimulus package is also comparable. The outlook for April 1, 2021 to March 31, 2022 should grow by 10 percent to 20 percent in value year-on-year due to global recovery post-pandemic; the advent of the EVx market; and the 5G rollout.
- For 2021, full-year, expect market drivers for capacitors, resistors and inductors to include 5G infrastructure deployment; battery electric vehicle production; automotive telematics and driver assist technology; solid state drives for cloud storage; higher performance computing; devices for the Internet of Things; the August 2021 Olympics in Japan; Post-pandemic revenge spending; smartphones; desktop and notebook personal computers; and game consoles to support the continuing remote working and learning trends worldwide.
- A significant number of market drivers suggest a robust 2021 for passive components. These include early reporting from vendors, rising raw material prices and increasing lead times.