Most designers know that dc bias significantly decreases the effective capacitance of Class II MLCCs. But is it enough to estimate the effective capacitance of an MLCC just by looking at the dc bias curve? What other factors also warrant scrutiny? We discussed MLCC DC BIAS in this article in depth. Herb Te-Jen Ma, application engineer manager at Samsung Electro-Mechanics Co. Ltd. (SEMCO) explains her view in article published by Electronic Design.
For decades, multi-layer ceramic capacitors (MLCCs) have been the go-to choice for surface-mounted capacitors due to their many advantages, such as wide available capacitance range, non-polarity, low ESR, and low cost. Most designers know that the effective capacitance of Class II MLCCs can be reduced significantly when dc bias is applied across the capacitor.
However, in addition to the dc bias effect, other important factors can impact the effective capacitance of Class II MLCCs. These factors include ac bias, signal frequency, temperature, and aging. This article aims to provide a holistic view of these effects, and serve as an introduction into a less-well-known phenomenon known as “aging under dc bias.”
Let’s start by looking at the dc bias effect, perhaps the most efficient reducer of effective capacitance. For example, the effective capacitance of a 1-µF, 6.3-V-rated X5R MLCC can be reduced to 0.36 µF by applying 3 V dc (47% of the rated voltage). Note that the standard signal condition for dc bias measurement is 500 mVRMS at 1 kHz. This shows a 64% reduction from the 1-µF nominal capacitance (Fig. 1).

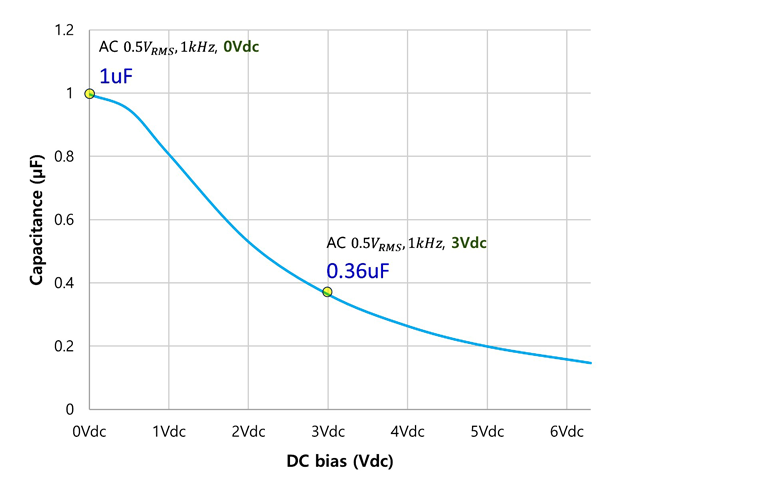
When dc voltage is applied, some of the barium titanate (BaTiO3; the dielectric material used by Class II MLCC) dipoles are locked down. These locked-down dipoles are no longer able to move when ac voltage changes, resulting in the decrease of capacitance. The dc bias effect has been well-observed by all electrical engineers.
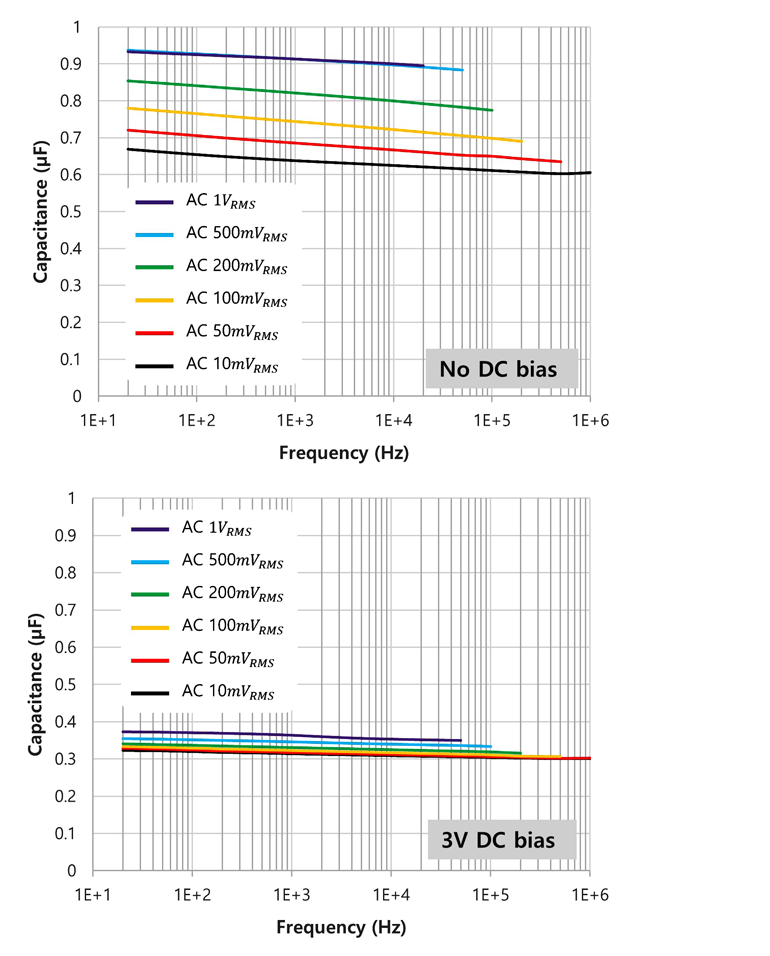
Now, if the ac level in the standard measurement condition is reduced from 500 mVRMS to 10 mVRMS while maintaining the same 1-kHz frequency and 3-V dc biasing, the effective capacitance will further drop to 0.32 µF, an additional 4% reduction. But, increasing ac signal amplitude increases the effective capacitance (Fig. 2), if only to an insignificant degree. But note this isn’t universally correct.


AC Voltage Dependency and DC Bias Effect
The mechanism of ac voltage dependency for effective capacitance is much more complicated than that of the dc bias effect. This is due to the nonlinear permittivity of the dielectric (hysteresis effect) between the applied electric field and electric flux density. In Figures 2 and 3, we observe that the measured capacitance increases as the ac signal increases, but note that the capacitance begins to decrease as the amplitude of the ac signal reaches a certain level.


Another key point is that the level of dc bias also impacts the effect of ac voltage dependency on effective capacitance. When the applied dc voltage is small, the ac voltage-dependency effect becomes much more prominent and the effective capacitance may drop as much as 30% if the ac voltage amplitude is also close to null (Fig. 3, again).
On the other hand, if the capacitance drop is already more than 50% due to dc bias effect (Fig. 2, again), the capacitance loss due to ac signal becomes much smaller. Consequently, depending on actual signal conditions, caution must be exercised in estimating the effective capacitance by taking both dc bias and ac voltage-dependency effects into consideration.
TCC and Frequency Dependency
Two other graphs that can be found on a typical MLCC datasheet are temperature characteristics of capacitance (TCC) and frequency-dependency characteristics. Compared to dc bias and ac voltage-dependency effects, the TCC and frequency-dependency effects are much less pronounced, contributing to less than 20% of capacitance change in most cases.
The TCC is regulated by the MLCC’s dielectric type, such as X5R, X6S, X7R, and so on. Thus, it comes as no surprise that the capacitance change will be within the definition of each dielectric type; for example, a 15% change for X5R or X7R. Do note, however, that the capacitance-change range as defined by TCC is independent of the capacitance tolerance. Therefore, for a 22-µF, 20%, X7R MLCC, the initial capacitance could be as low as 15 µF in the worst-case scenario [22 µF × 80% (low end of the tolerance) × 85% (assuming it retains 85% of capacitance at 125°C) = 14.96 µF], and this is even before any voltage is applied.
Figure 4 shows how the capacitance value decreases as the frequency of ac signal increases for the same 10-V, 1-µF MLCC. The changes in capacitance become even smaller when dc bias is applied.

The MLCC aging effect states that the capacitance of an MLCC decreases logarithmically with time, according to the following equation:
C(t) = C(t0)*(1-k*log10 (t)),
where C(t0) = initial capacitance value; C(t) = capacitance value, t hours after the start of aging; k = aging constant, which varies with MLCC type; and t = aging time.
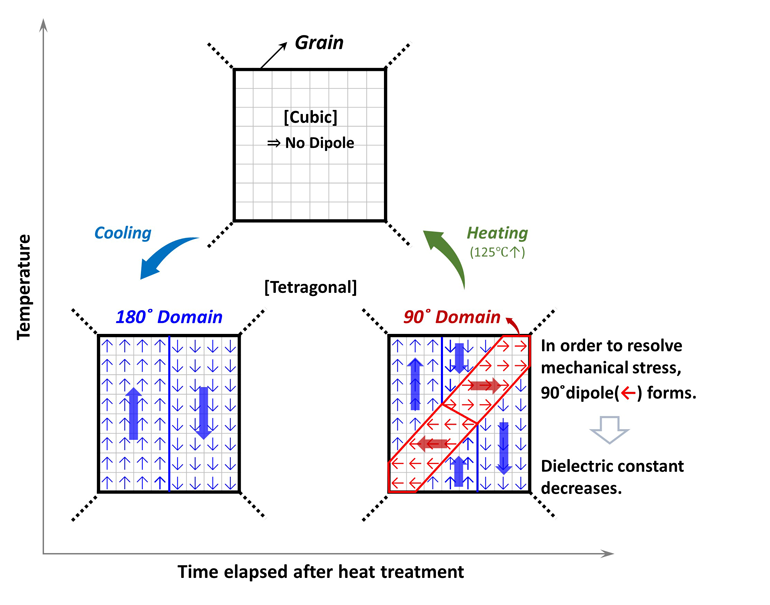
The aging phenomenon is due to the internal structural characteristics of BaTiO3, where the capacitance decreases as the dipoles rearrange their orientation slowly to stabilize internal mechanical stress (Fig. 5). Typically, aging behavior is relatively less of a concern for two reasons. First, aging is reversible. The decreased capacitance can be recovered by heating the MLCC above 125°C, or the Curie point, at which the dipoles are realigned and the capacitance restores. Such heat treatment is called “de-aging” and is observed before nominal capacitance measurement.

Second, given the logarithmic nature of capacitance drop, the loss in capacitance is most significant within the first 1000 hours of de-aging. The effective capacitance of MLCCs essentially “stabilizes” after 1000 hours as the capacitance drop becomes trivial. Nonetheless, aging is still an important topic for designers to consider from a product reliability point of view, as almost all end products in nature have to be operational beyond the 1000-hour mark.
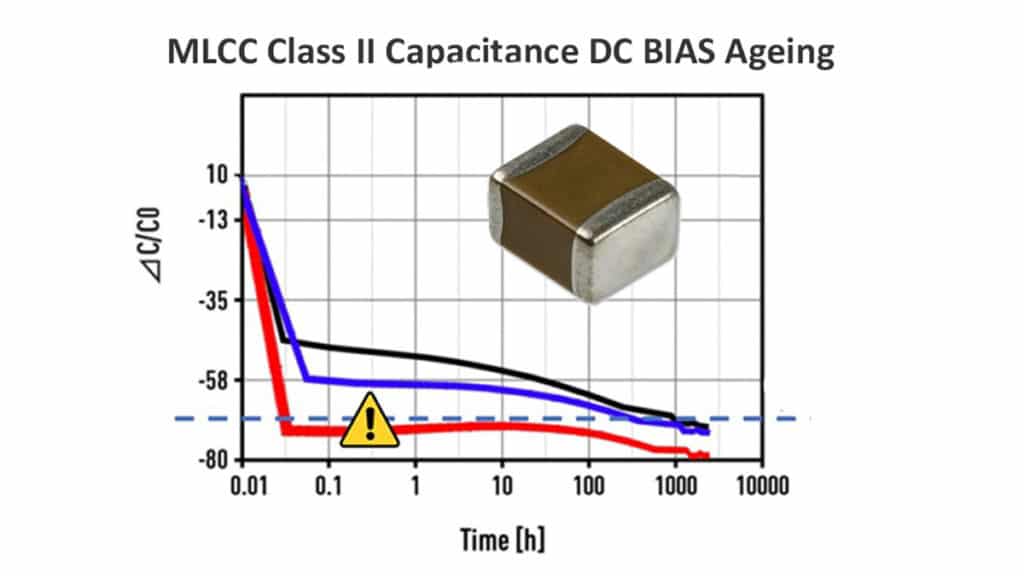
Aging and DC Bias
Another topic related to aging, albeit much less understood, is the capacitor’s aging behavior under dc bias. This topic is much more important than it seems, as MLCCs are very often used as bypass capacitors in power rails to maintain the dc voltage of these rails. It means these capacitors are under constant dc electric fields. Intuitively, one may think that the effects of aging and dc bias are additive—the aging curve should simply shift down when dc bias is applied. This seems to be plausible as dc bias doesn’t vary with time, but it’s simply not the case in reality.
In the real world, the capacitor aging behavior under dc bias is shown in Figure 6. Initially, the effective capacitance curve drops almost immediately after a dc electric field is applied. This is the dc bias effect at work due to the dipole lockdown. After the dc bias effect lessens the effective capacitance (this happens in the order of seconds), the aging effect starts to kick in and continues to work for up to 105 seconds and beyond.

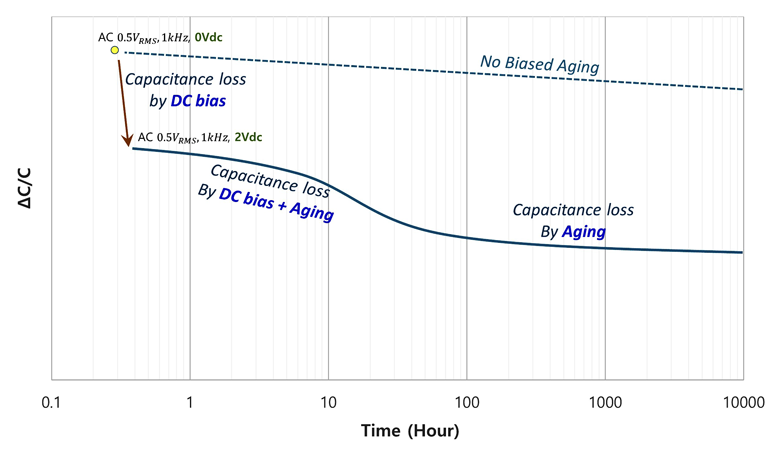
However, it should be noted that after the aging effect kicks in, the applied dc bias actually drops the effective capacitance even further down than the linear sum of capacitance drop from dc bias and from the aging effect combined. This is because during dipole switching (Fig. 5, again), the dc bias actually helps the 90° dipole domain align to the BaTiO3 lattice axis that has the lowest permittivity, hence the further reduction in capacitance.
Important though it may be, the aging behavior of MLCCs under dc bias has regrettably not been a focus in effective capacitance simulation. Consequently, it’s not a spec that can typically be found in an MLCC datasheet. In addition, this capacitance-drop behavior depends heavily on the material type and the design structure of a given MLCC. So, for designs in which performance is sensitive to effective capacitance, experimental measurement of the actual capacitance decrease becomes the only way to accurately understand the aging-under-dc-bias behavior for a specific MLCC.
MLCCs aren’t just for smaller, faster, cutting-edge devices, but rather are a building-block component found in a myriad of applications. A complete understanding of MLCC effective capacitance will not only help a designer build a system that’s more stable and robust, but can also help prevent any potential reliability issues down the road, especially after end products are in the field.