


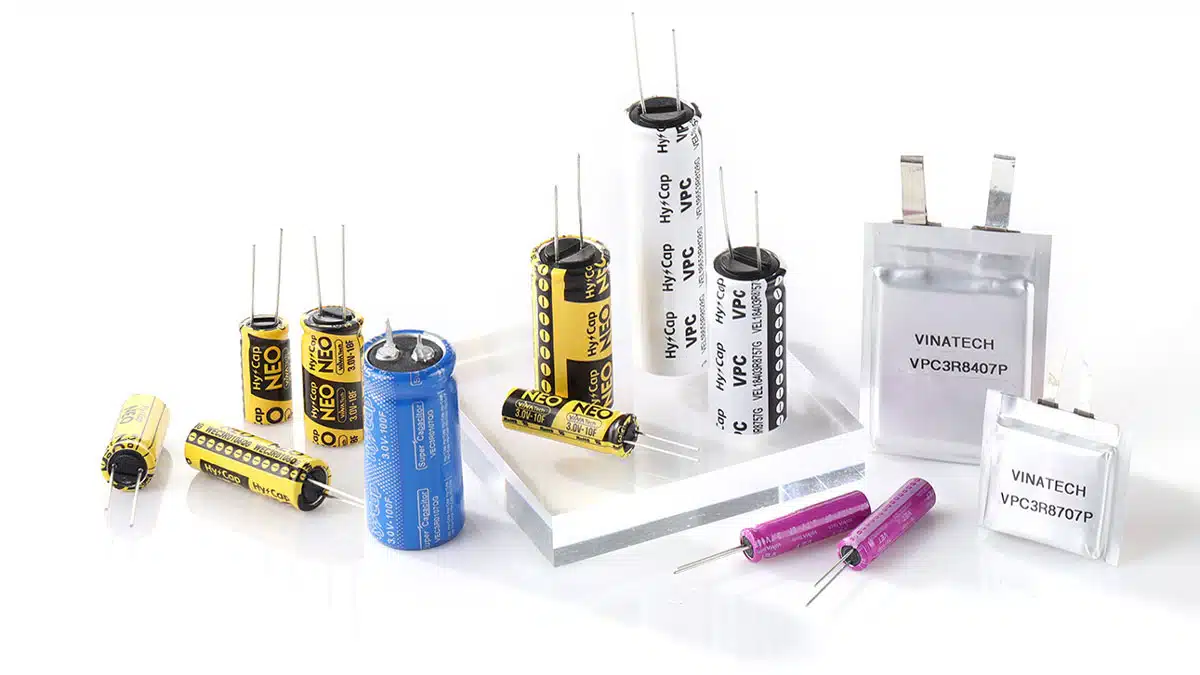
Supercapacitors (or ultracapacitors) are one of the most progressing capacitor technologies in recent years offering very high DC capacitance and high energy densities. It is proved its reliability and design flexibility to provide wide range of energy storage solutions from small wearables, industrial applications, automotive to large energy power network backup systems.
Key Takeaways
- Supercapacitors, or ultracapacitors, offer high capacitance and energy density compared to traditional capacitors and batteries.
- They store energy through two mechanisms: electrostatic charge storage and pseudocapacitance, with various types available like EDLC and hybrid supercapacitors.
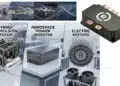
- Supercapacitors provide functions like backup power in automotive systems and are becoming essential for electric and hybrid vehicles.
- Their longevity depends on proper use regarding voltage limits, temperature, and electrolyte type, with a lifespan exceeding 10 years under optimal conditions.
- Despite their high power density and cycle life, supercapacitors cannot fully replace batteries due to lower energy density and higher self-discharge rates.
Sometimes all supercapacitors are mis-called as EDLC (Electric Double Layer Capacitors), however EDLC is a one subset of supercapacitor family.
Supercapacitors features sit between capacitors and batteries, with a firm cell rated voltage between 1 and 3.8V. Since its introduction, supercapacitors has proved to be very reliable; with continuous long life operation and practically no charge/discharge cycle wear out.
Supercapacitors Introduction and Construction
Introduction and Basic Function
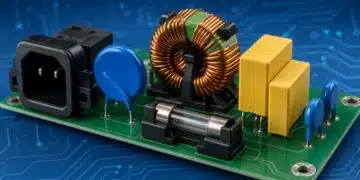
Supercapacitors are used as DC energy storage media, short high power charge storage (automotive start-stop systems), back-up for semiconductor memories and microprocessors etc. New designs in larger modules have opened up space for a number of power applications that concur rechargeable batteries.
There is no fixed dielectric material and charge is accumulated in interface between active electrodes and the electrolyte. There are two basic mechanisms of charge storage:
- Electrostatic Charge Storage
- Pseudocapacitance Electrochemical Charge Storage
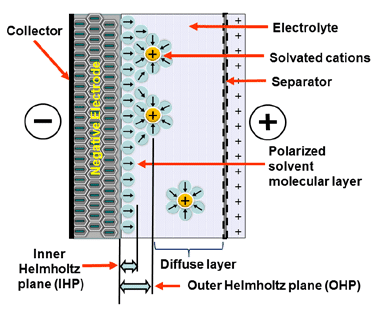
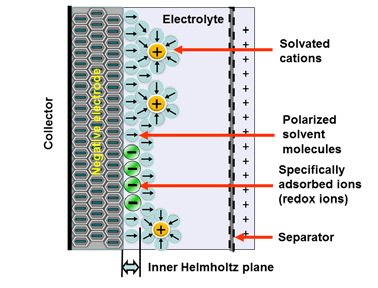
Electrostatic storage is based on accumulation of charge in charge traps within so called Helmholtz layers (inner and outer) – see Figure 1. Pseudocapacitance storage is electrochemical process, where charge is accumulated by adsorbed ions. – see Figure 2.
Mix of both charge storage mechanisms present in real supercapacitors. Dominant charge mechanism that present in supercapacitors defines three categories as shown in Figure 3.
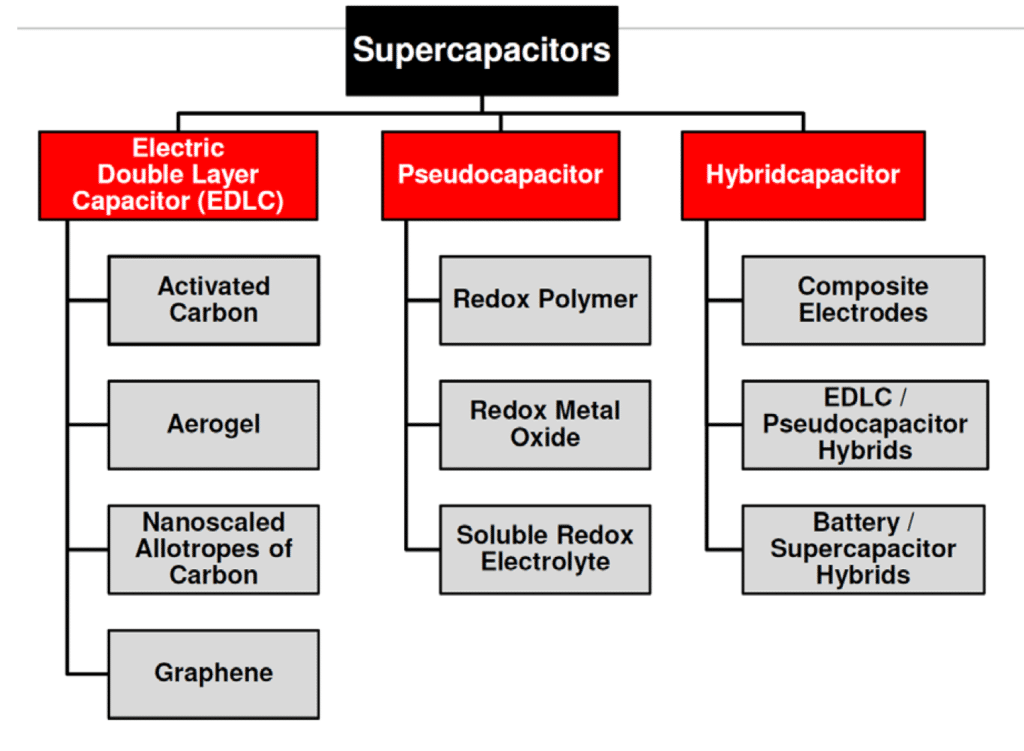
- EDLC Electric Double Layer Capacitors with electrostatic charge mechanism dominance
- Pseudocapacitors – electrochemical charge dominance
- Hybrid – one electrode with electrostatic and second with pseudocapacitance mechanisms dominance
EDLC capacitors are using high surface synthesized electrodes based on activated carbon, carbon nano-tubes or graphene. Alternatively, the electrodes can be made from cheap “bio-waste” monolithic material with a natural hierarchy of pore sizes such as coconuts, melon rinds, wood, fish scales etc.
EDLC capacitors with symetrical electrodes are non-polarized but are in practice supplied with a polarity marking that should be followed. One reason is that the positive electrode (+) may be processed differently from the negative one (-).
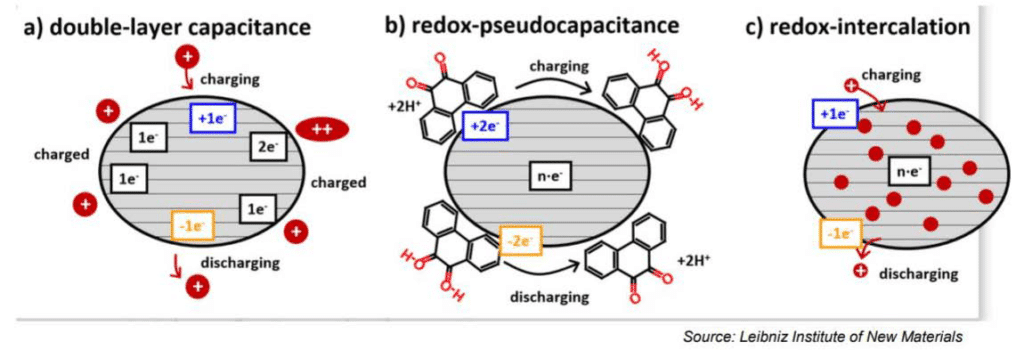
The electrochemical storage – pseudocapacitance – is not related to any electrochemical reaction – in difference to batteries.
The charge can be stored by mechanisms such as redox-pseudocapacitance or redox-intercalation – see Figure 4. below.
It is also possible to combine hybrid designs with other electrode technology such as
- capacitor hybrid: wet tantalum hybrid capacitor – one electrode tantalum anode and second electrode supercapacitors
- battery hybrid: supercapacitor one electrode and second battery electrode
Construction
Electrodes
Superacapacitor construction is explained on EDLC symetrical structure, nevertheless the basic design concept is also valid for pseudocapacitors that target boosting electrochemical storage using different materials, processes and electrolytes.
When we apply a voltage over the capacitor, existing ions in the electrolyte go through the membrane to their respective electrode, i.e., to the surface of the activated carbon that via the electrolyte is connected to the current supply electrodes. The ions are captured of the activated carbon surface where they attract reverse charges inside the carbon (Figure 5. and 6.). We thus have a double layer of charges. Hence the name double layer capacitor. A schematic taken from a modern construction is shown in Figure 6. The original designs from 1970s used a membrane and conductive rubber as a current collector as shown in Figure 5. In modern constructions membrane is replaced with a separating porous foil and the conductive rubber with a current collector, usually an aluminum foil – see Figure 6. Structure of wound – stacked type using aluminum foil as current collector is shown in Figure 7.
Figure 5. illustrates how the activated carbon and the ions in the electrolyte work together.

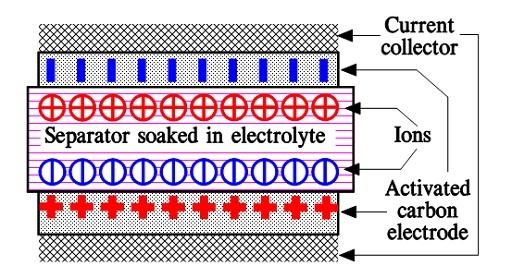
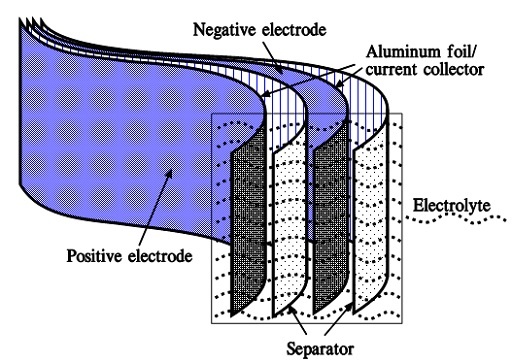
Because the distance between the charges is small – ion diameters – , and furthermore, because the total carbon surface is enormous the charge quantity will be extremely large. The capacitance range amounts to the magnitude of several thousand farads.
The continuous development to enlarge surface area has resulted in sophisticated active electrode system based on carbon active layer (carbon fibers), carbon nano-tubes (CNT) or the latest design with graphene.
Electrolyte
Applied voltage, efficiency and power handling also depends to selection of electrolyte. Electrolyte provide a media that supports creation of charge on interface with electrodes, enable its mobility or provide adsorbed ions as charge carriers (pseudocapacitance). Electrolyte matching with electrode system is thus essential to achieve both maximum energy and power density and also define its cell voltage.
There are currently three types of electrolytes:
- aqueous based
- organic based (liquid or solid/gel)
- ionic liquids
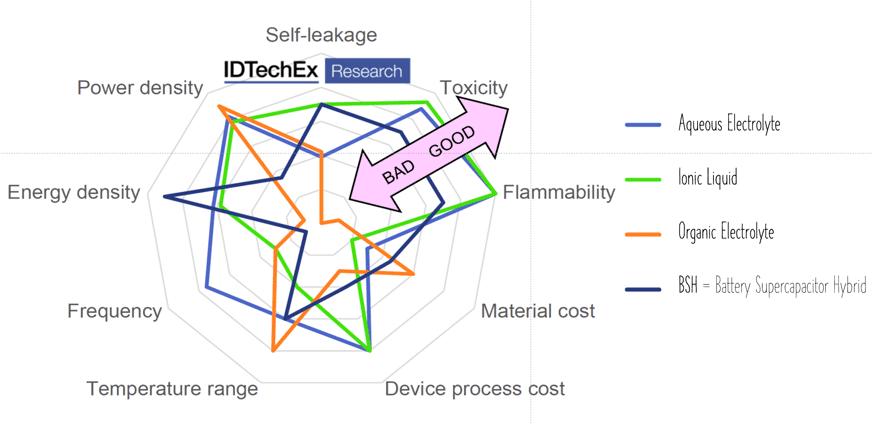
Aqueous electrolytes provide good conductivity at no toxity, however, maximum voltage reach 1.2 V.
Organic electrolytes are capable of maximum ~3 V and providing better temperature range, nevertheless they can be limited by flammability or toxicity. Solid organic electrolytes usually consist of conductive polymers characterized by low ESR values and corresponding power pulse capabilities.
Ionic liquids, the latest electrolyte development steps, are salts in liquid form rich on ions and short-lived ion pairs. This electrolyte enabled further increase of maximum voltage to ~3.7 V at no issue with flammability or toxicity – see spider chart benchmarking electrolyte types in Figure 8.
If voltage is higher than the maximum cell voltage the electrolyte starts decomposing to form H2 and O2. Just below that voltage the surge voltage is specified and with some margins to the surge voltage we find the rated cell voltage.
further reference: Electrolyte Selection and Performance in Supercapacitors
ESR Resistance
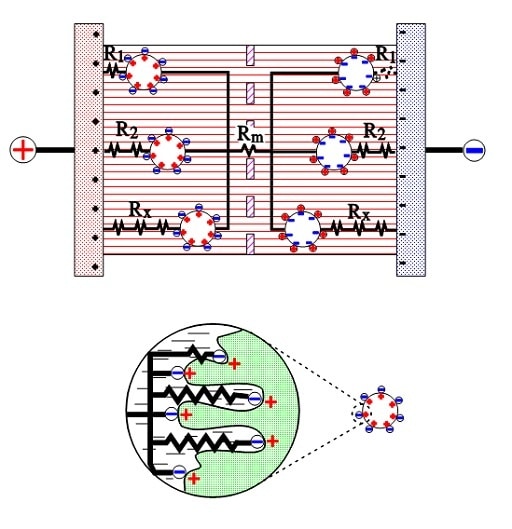
The active electrode (carbon) particles in the dispersion variant have via the electrolyte and via adjacent particles connection with the current supply electrodes. Some particles are situated close to its electrode and have a comparatively small contact resistance, others have long contact chains and manifold larger connection resistances. In Figure 9. three particles are shown with the series resistances R1, R2 and Rx, where R1 < R2 << Rx. The figure also shows the membrane resistance Rm in the electrolyte. The carbon particles are not spheres but have a surface with hollows and channels, just as the etched surface of an aluminum foil, but even more enlarged. See the schematic enlargement in the figure.
The electrolyte resistance from the inlet to the bottom of a channel will be considerable. The charges in the channel get a varying contribution of series resistances, depending on location in the channel, a contribution that shall be added to those resistances R1, R2…. , intimated in the entire view. This results in a multitude of elementary capacitances mutually connected in parallel in a complicated resistor network whose part resistances differ between themselves with a number of powers of ten. The time constants of the respective elementary capacitances varies from fractions of a second to hundreds of hours. The resistance network can be summarized to an ESR that varies with capacitance, type and manufacture from milliohms to several hundred ohms at RT. What contributes to the lower ESR values of modern ultracapacitors is the more conductive organic electrolytes or ioniq liquids as well as improvements in the contact medium between the active electrode particles and current collectors.
Because the ESR present in many backup capacitors is large compared to aluminum electrolytics it limits the ripple current use. A usual limit for the heat release is set to +2 °C.
Note that we don’t have any real dielectric, only a face boundary between electrode and electrolyte of 2 to 5 nm, that prevents respective charges from passing.
Series connection
Energy increase with voltage squared, thus modern high power electronics require work in 16, 25, 35, 50, 110 volt ranges, which requires multiple cell linking (2 to 4 V). The automotive market push towards 48 volt subsystems.
That raises concern about reliability of units containing multiple cells linked together. If we in electronic designs want to connect discrete capacitors in series to meet higher working voltages we should use the same type of elements.
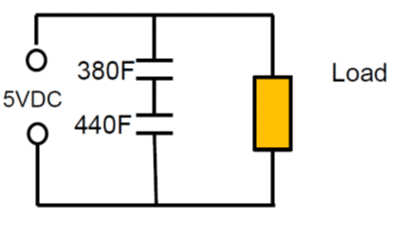
As an example: Series connection of 2pcs 400F 2.5V cells with +10/-5% cap tolerance in worst case scenario will end up with 380F and 440F caps on the board. The voltage of the individual cells will split accordingly to: 2.68 V: 2.32V that exceeds rated voltage of the first capacitor.
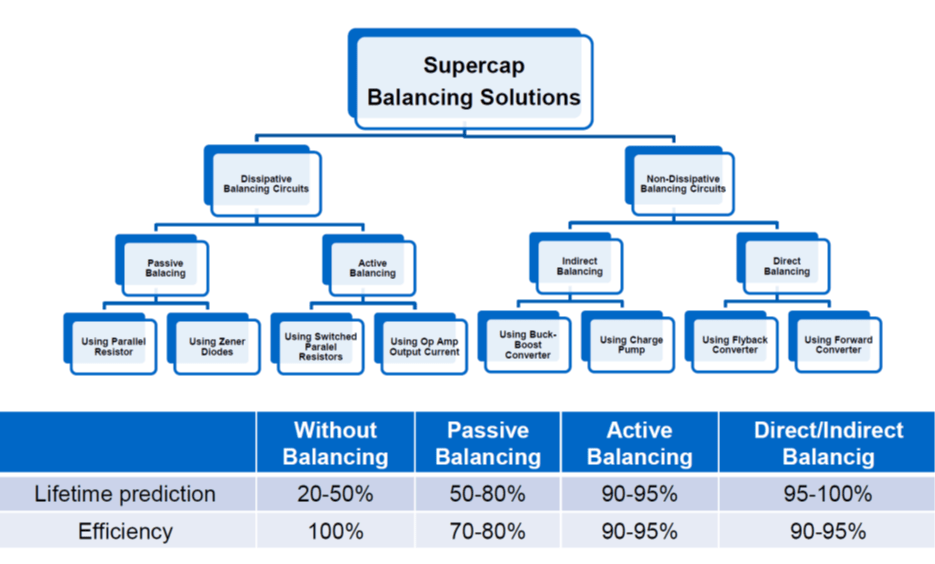
As noted from electrolyte decomposition, the rated cell voltage of supercapacitors (or surge voltage, if specified) must not be exceeded. Exceeding the maximum cell voltage considerably lower life time of supercapacitors, thus use of balancing circuits are strongly recommended when connecting unit cells in series to attain higher rated voltages.
Picked from a manufacturer datasheet: Rule of thumb by EDLC supercapacitor lifetime prediction is:
- With every 0.2 voltage decrease the cell lifetime increases about 2x in the specified voltage range
- With every 0.1 voltage increase over the spec V the cell lifetime gets half
see figure11. comparison of balancing methods and its impact to lifetime and efficiency.
If we don’t use external voltage dividers it is recommended as a precaution that the applied total voltage divided by the number of linked cells does not exceed 85% of the rated cell voltage.
Note: Low voltage (~1.8V) aqueous electrolyte type may not require balancing on higher voltage modules as the variability of applied voltage on high number of cells/layer may not be critical.
See in-depth technical article on supercapacitor balancing methods and its comparison. Other article on supercapacitor active balancing evaluation was presented during PCNS Passive Components Networking Symposium 2019: Evaluation of Active Balancing Circuits for Supercapacitors
Supercapacitors Features and Measurement
The Time Constant, t
The time constant of capacitors is the time needed to discharge a loaded capacitor through the insulation resistance (IR) to 1/e (~37%) of the initial voltage. This constant denominated t(tau) is the product of IR and C (capacitance), usually abbreviated RC. Supercapacitors don’t have any dielectric even if the true leakage current represents a kind of “internal DC resistance”. What is of importance with supercapacitors is their ability to absorb and release electric charges. This depends on their ESR. The more conductive the electrolyte and the better construction that facilitates the current flow, the lower is the ESR and consequently the faster the charge and discharge time.
Some types of supercapacitors have considerable time constants while especially power-burst designs are characterized by very small ones, ranging from milliseconds to minutes.
Supercapacitors Energy Density (Wh/kg) and Power Density (W/kg)
Electrochemical capacitors have compared to conventional electrolytic capacitors approximately 10-100 times higher energy density (also called specific energy) expressed in Wh/kg. If we compare with conventional electrostatic capacitors the specific energy is approximately 100 times higher. Despite supercapacitors are subjected to fast developments, batteries still may have typicaly 10 to 100 times as much energy density (as battery development is also significantly moving forward).
Comparisons on power density show another picture. Electrochemical capacitors having considerable ESR values and time constants of 1 to 100 seconds equal batteries with respect to power density. They in recent years marketed power supercapacitors can deliver 10 times the power of conventional batteries or with latest graphene electrode design can get very close to electrolytic capacitors. Their time constants range from below 0.1 second to 30 seconds.
Supercapacitor Comparison Table
The table below summarizes the key performance characteristics of different energy storage technologies relevant to power electronics and passive component design:
| Parameter | Electrolytic Capacitors | EDLC (Supercapacitors) | Lithium-Ion Capacitor (LIC) | Li-ion Batteries |
|---|---|---|---|---|
| Energy Density (Wh/kg) | ~0.01–0.1 | ~5–10 | ~10–20 | ~150–250 |
| Power Density (W/kg) | ~1,000–10,000 | ~5,000–15,000 | ~2,000–8,000 | ~300–1,000 |
| Cycle Life (cycles) | ~1,000–10,000 | ~500,000–1,000,000 | ~50,000–100,000 | ~500–2,000 |
| Operating Voltage (V/cell) | 2.5–500+ | 2.5–3.0 | 3.0–3.8 | 3.2–4.2 |
| Charge Time | Milliseconds | Seconds | Minutes | 30–60 minutes |
| Operating Temp. Range | -40°C to +125°C | -40°C to +70°C | -20°C to +70°C | 0°C to +45°C |
| Self-Discharge Rate | Low | High (~30%/month) | Moderate | Low (~2%/month) |
| Typical ESR | mΩ to Ω | mΩ range | mΩ to Ω | mΩ |
| Cost ($/Wh) | Low | High | Medium | Medium-High |
Applications
As already mentioned in the introduction supercapacitors seem to be very reliable claiming a service life widely exceeding 10 years. Together with capabilities of charge/discharge cycles ranging to millions they offer maintenance free products of high interest, especially when combined with rechargeable batteries.
Supercapacitors play two main functions in electronic circuits. In battery-powered devices, they provide backup power in the event of disconnection. They also provide alternating current (AC) voltage for devices with heavy switching currents. In that case, supercapacitors protect the device’s memory, for example, from large voltage drops.
They have a high power density and their capacitance range from several farads to several thousand farads which make them perfect for high power-burst applications. Nevertheless watch for low end “no-name” supercapacitors as there are also “cheap” technologies on the market with significantly worse capacitance drop versus cycles/life time or operation at higher temperatures.
High power-burst application can be divided into two categories. The first one is small-cell designs. They belong mainly to applications like digital cameras, wire-less PCs and the like where they are used to load-level pulses from such energy sources as batteries and fuel cells.
The second category is large-cell types. They will be found in for example automotive applications and as UPS (uninterrupted power supplies) in industrial applications. Whether it is small-cell or large-cell supercapacitors utilized in power-burst applications they will relieve the battery of pulsed power functions. That means possibilities to utilize smaller power batteries.
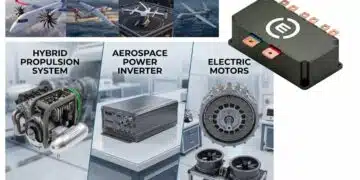
In electrical vehicles (EV) and hybrid electric vehicles (HEV) combination of batteries and supercapacitors is providing high power immediate capability and longer energy supply. Supercapacitor are also popular solution for start-stop systems that is integrated in vehicle energy recuperation energy management system to lower emission and consumption of combustion engine vehicle (CE) and HEV. As already mentioned these supercapacitors can deliver more than 10 times more power than the batteries. Especially at lower temperatures, where the supply of power from batteries might be quite insufficient supercapacitors can be the solution. Some of them can operate successfully down to –40°C. Batteries have very limited power in cold and the supply of power for starting may be quite insufficient. They can on the other hand trickle-charge the supercapacitor that in turn has the power necessary for starting.
Many of these supercapacitors can be discharged down to 0 V. On the other hand, one major limitation of supercapacitors that is blocking complete replacement of batteries in combustion engine vehicles is their higher self-discharge/DCL and its significant increase at higher temperatures – see further bellow and illustration in Figure 21.
Read more at article: Supercapacitor Benefits in Backup Power and Load Management Applications
Charge and Leakage currents
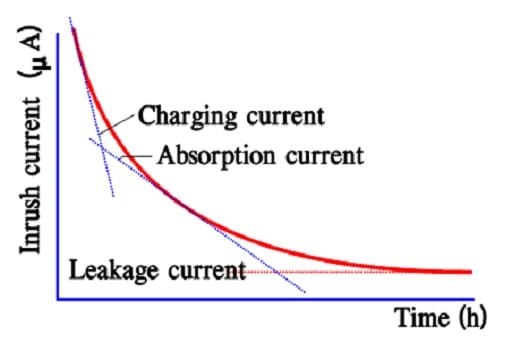
In aqueous electrolyte constructions as well as in some organic electrolyte types we could, with respect to time, distinguish three different types of current components:
- a charging current, Ich,
- an absorption current, Iabs,
- a leakage current, DCL.
The charge current charges the different capacitor elements. A large part of this “operating charge” can take place within fractions of a second but the exchange increases if we extend the time to minutes or even more. Even if ESR limits the surge current at rapid charges/ discharges, a current limiting resistance in the same magnitude as the ESR is recommended for use.
As was seen in the previous section there is a very large distribution of time constants for the different capacitor elements. The most inert ones never will be charged within a reasonable time. Once they are charged they won’t participate in discharges taking place under a certain practical time. They have been absorbed. The absorption process is characterized by the so called absorption current during charging.
After a very long charging time we reach a limit for all charging currents. There is left a current, the true leakage current. In reality it is independent of time since it exists all the time. Figure 12. and 13. show examples of the three current components and their time dependence.
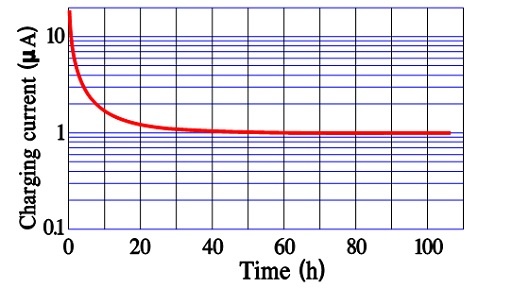
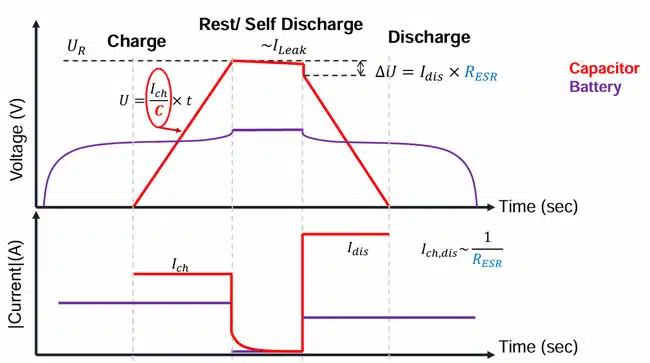
In modern power supercapacitors the charge/discharge times are so small that there is no significant difference between the first two current components discussed above. Typical charge / discharge behaviour is shown in the Figure below.
Measurements
Leakage current
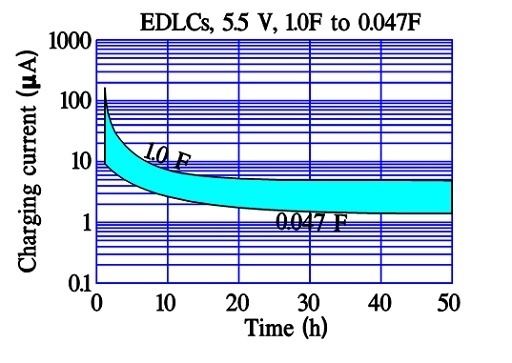
The leakage current, DCL, sometimes is called bias current and is specified after 10, 30 or 60 minutes of applied rated voltage. As can be seen by Figures 12. and 13. these times actually are too short for a true DCL determination. For reciprocal comparisons, however, they serve their purposes.
It is remarkable that some manufacturers of power supercapacitors (where the charge/discharge time is specified from 0.3 to 30 seconds) specify DCL measurements after 12 or 72 hours of applied rated voltage.
Capacitance
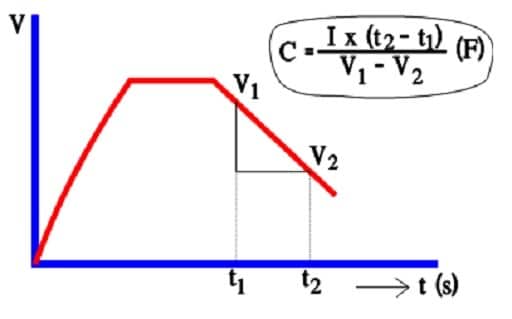
In spite of decreasing ESR values in modern designs AC measurements of capacitance is regarded to be in-accurate. Instead a discharge with constant current is resorted to (Figure 15.).
The capacitance determination is based on the fundamental formula Q = C x V. But, at constant current Q = I x t.
That means that according to the figure: C x (V1-V2) = I x (t2-t1).
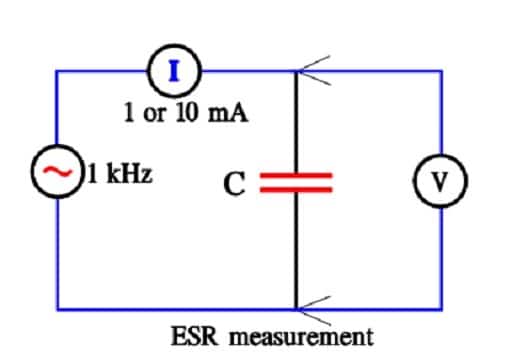
ESR
ESR is measured at 1 kHz and at a constant current of 1 or 10 mA.
Life calculations
Estimated life versus voltage and temperature is mostly specified by supercapacitor manufacturers as follows, nevertheless it can be specific to the supercapacitor technology, so it is recommended to check the manufacturer datasheets.
Roughly the life will be reduced with more than 2 times (more accurate 2.23 times) for every 10 degree C increase. If we use the formula [1] it should be written:
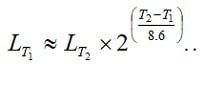
[1]
Life dependence of working voltage can be expressed with the formula [2]. Because we deal with electrolytics the exponent is significantly higher than that of electrostatics, i. e., n » 17, which gives us the following equation:
[2]
According to the manufacturer’s graphs (and the formula above) there will be an approximate halving of life for every 4.4 % voltage increase above VR and a corresponding life increase for derating with 4.4 %.
Environmental operation risks
Avoid use of non-hermetic types at:
- environments with a high RH
- corrosive gases
- cleaning agents with Freon TMC or Trichloro-ethylene.
Characteristics
Discharging
At a discharge of the capacitor the voltage follows the equation
[3]
, where:
[4]
But at 1 to 100 mA load RL >> ESR and Rp >> RL. Then R ≈ RL and the discharge time t = – CRL ln(VC/E0). Semiconductor memories on the other hand will draw less than 10 *A. In these cases RL >> ESR and
R ≈ RpRL/(Rp+RL).
The following diagram on Figure 18. is taken from either of the established manufacturers and may differ between the manufacturers.
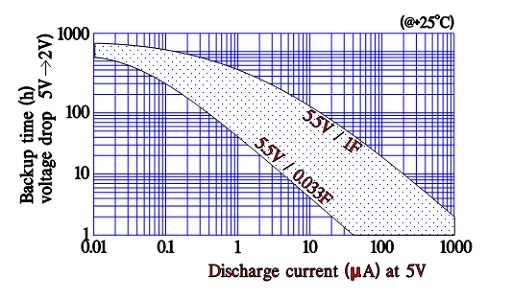
Discharge current versus back-up time
Manufacturers of supercapacitors used for back-up purposes specify voltage versus back-up time/holding time for different discharge currents. The time is related to discharge from rated voltage down to 2 V (where its back-up function ends).
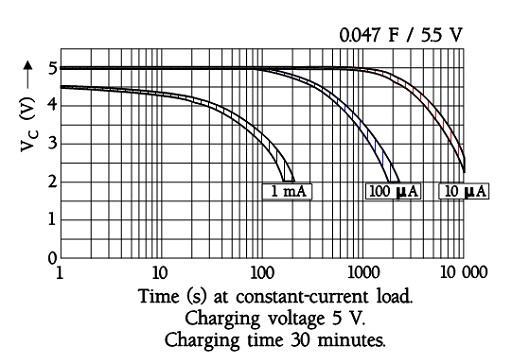
Discharge conditions
The following figure shows a diagram of constant-current discharge curves for a EDLC supercapacitor with an ESR of maximum 120 ohms at 1 kHz. Note the sudden voltage drop of 0.5 V in the 1 mA curve. It is related to the internal DC resistance. At 0.1 mA it is not visible.
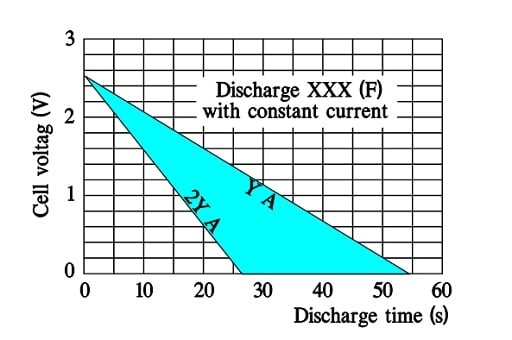
Discharge curves for ultracapacitors with small ESRs exhibit straight discharge curves. Fictitious curves for a large supercapacitor capable of a discharge to 0 V may have the following appearance where the discharge currents are called Y and 2Y (A).
Note that a doubling of discharge current means a halving of the discharge time.
Self-Discharge
The internal leakage of electric charges will gradually decrease the initially applied voltage. The following two figures illustrate the phenomenon.
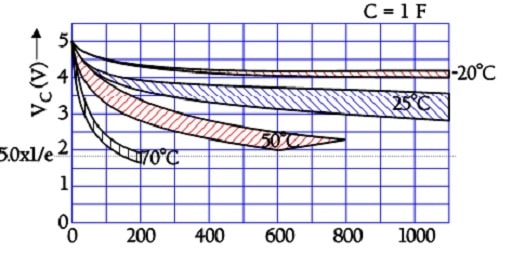
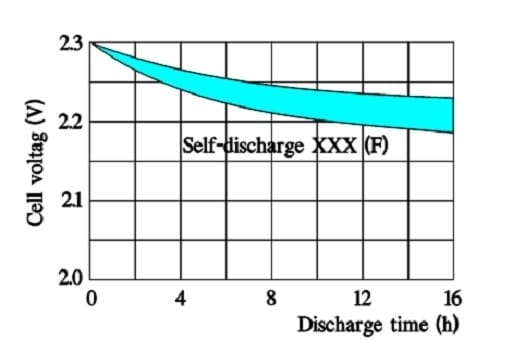
In the above figure we can see that the time constant, – i.e., the time it takes for the voltage to drop to 1/e of the initial voltage, – is very large even at +70 °C. Larger supercapacitors characterized by lower ESR values may have the following self-discharge curve. Always consult the manufacturer for accurate specifications.
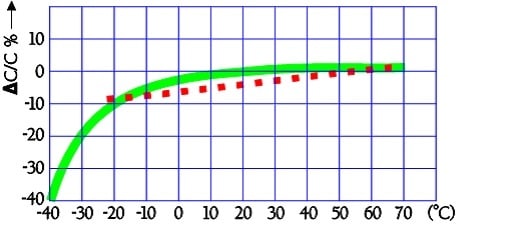
Temperature dependence
The typical capacitance dependence of temperature may look like the following curves in Figure 23.
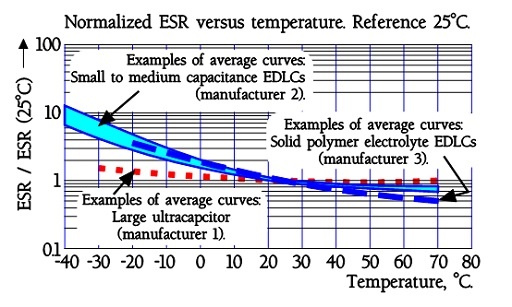
The quotient ESR-25°C / ESR+20°C will be ≤ 5. Larger modules are specified ESR-25°C / ESR+20°C ≤ 10.
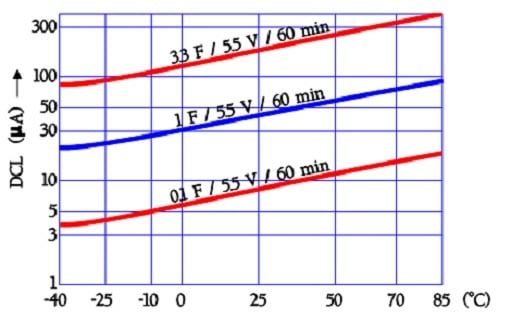
The following diagram shows curves for temperature dependence of the leakage current in older aqueous electrolyte capacitors. Because the fundamental double layer construction is valid also in newer EDLCs we have reason to believe that the temperature dependence is still present even if the magnitude may differ.
The leakage current examples in Figure 25. are based on readings after 60 minutes of electrification with 5.5 V dc. Charging for 10 or 30 minutes will of course give other values.
The quotient DCL70°C /DCL 20°C will be ≤ 4.
A supercapacitor (also called ultracapacitor) is an energy storage device with capacitance values thousands of times higher than conventional capacitors. Unlike normal capacitors that use a dielectric, supercapacitors store charge at the electrode–electrolyte interface through electrostatic and electrochemical mechanisms.
There are three categories:
EDLC (Electric Double Layer Capacitors) – electrostatic charge storage using high-surface carbon.
Pseudocapacitors – electrochemical charge storage via redox reactions.
Hybrid supercapacitors – one electrode behaves like an EDLC, the other like a pseudocapacitor or even a battery electrode.
Supercapacitors offer very high power density, extremely long cycle life (millions of charge/discharge cycles), and reliable operation at low temperatures. However, they have lower energy density than batteries, so they are often used in combination with them.
They are used in:
Automotive start-stop systems and regenerative braking.
Backup power for memory and processors.
Industrial UPS and grid support.
Portable electronics for pulse power delivery.
Exceeding the rated cell voltage or operating at high temperatures accelerates electrolyte decomposition and increases leakage current. Using balancing circuits in series connections and derating voltage improves lifetime.
No. It is rather complimentary technology. While they excel in power delivery and cycle life, their higher self-discharge and lower energy density prevent them from fully replacing batteries in most applications. Instead, they are often paired with batteries to improve system performance.
How to Connect Supercapacitors in Series Safely. Follow these steps to connect supercapacitors in series while preventing overvoltage and ensuring long lifetime.
- Check capacitor ratings
Verify the rated voltage and capacitance of each supercapacitor cell. Use only cells of the same type and tolerance.
- Arrange cells in series
Connect the positive terminal of one capacitor to the negative terminal of the next until the desired voltage rating is reached.
- Add balancing resistors or circuit
Install passive resistors across each cell or use an active balancing circuit to equalize voltage distribution.
- Measure voltage distribution
Use a multimeter to check that each cell voltage remains below its rated maximum (typically 2.7–3.0 V).
- Derate for safety
Operate the series stack at no more than ~85% of the combined rated voltage to extend lifetime.