Passive Components Blog
No Result
View All Result
  • Home
  • NewsFilter
    • All
    • Aerospace & Defence
    • Antenna
    • Applications
    • Automotive
    • Capacitors
    • Circuit Protection Devices
    • electro-mechanical news
    • Filters
    • Fuses
    • Inductors
    • Industrial
    • Integrated Passives
    • inter-connect news
    • Market & Supply Chain
    • Market Insights
    • Medical
    • Modelling and Simulation
    • New Materials & Supply
    • New Technologies
    • Non-linear Passives
    • Oscillators
    • Passive Sensors News
    • Resistors
    • RF & Microwave
    • Telecommunication
    • Weekly Digest

    Bourns Extends Rotational Life Option for its Guitar Potentiometer

    Modeling and Simulation of Leakage Inductance

    Power Inductor Considerations for AI High Power Computing – Vishay Video

    TAIYO YUDEN Releases Compact SMD Power Inductors for Automotive Application

    Fischer Releases High Vibration Robust Ratchet Locking USB-C Connector System

    Littelfuse Unveils High-Use Tactile Switches with 2 Million Cycle Lifespan

    KYOCERA AVX Releases Compact High-Directivity Couplers

    Supercapacitors Emerge as a Promising Solution to AI-Induced Power Energy Spikes

    Wk 18 Electronics Supply Chain Digest

    Trending Tags

    • Ripple Current
    • RF
    • Leakage Current
    • Tantalum vs Ceramic
    • Snubber
    • Low ESR
    • Feedthrough
    • Derating
    • Dielectric Constant
    • New Products
    • Market Reports
  • VideoFilter
    • All
    • Antenna videos
    • Capacitor videos
    • Circuit Protection Video
    • Filter videos
    • Fuse videos
    • Inductor videos
    • Inter-Connect Video
    • Non-linear passives videos
    • Oscillator videos
    • Passive sensors videos
    • Resistor videos

    Modeling and Simulation of Leakage Inductance

    Power Inductor Considerations for AI High Power Computing – Vishay Video

    Coupled Inductors in Multiphase Boost Converters

    VPG Demonstrates Precision Resistor in Cryogenic Conditions

    Comparison Testing of Chip Resistor Technologies Under High Vibration

    EMC Challenges for High Speed Signal Immunity and Low EMI

    MOSFET Gate Drive Resistors Power Losses

    Modified Magnetic Reluctance Equivalent Circuit and its Implications

    Improving Common Mode Noise Reduction while Decreasing BOM

    Trending Tags

    • Capacitors explained
    • Inductors explained
    • Resistors explained
    • Filters explained
    • Application Video Guidelines
    • EMC
    • New Products
    • Ripple Current
    • Simulation
    • Tantalum vs Ceramic
  • Knowledge Blog
  • Suppliers
    • Who is Who
  • Events
No Result
View All Result
Passive Components Blog
No Result
View All Result

Fix poor capacitor, inductor, and DC/DC impedance measurements

8.6.2016
Reading Time: 6 mins read
A A

source: EDN article

Steve Sandler -June 07, 2016
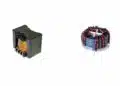
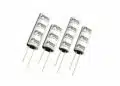
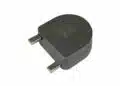
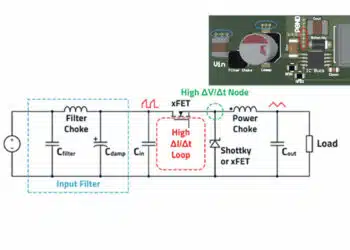
When designing or optimizing a VRM (voltage Regulation Module), we need its output impedance data and impedance data for the filter inductors and capacitors for us to have complete simulation models. Unfortunately, vendor data on these components is often incomplete, erroneous, or difficult to decipher in terms of the setup involved to make the measurement. Thus, we often need to collect the data ourselves.

RelatedPosts

Bourns Extends Rotational Life Option for its Guitar Potentiometer

Modeling and Simulation of Leakage Inductance

Power Inductor Considerations for AI High Power Computing – Vishay Video

The measurements need to be performed over the entire frequency range of interest, typically from a few kiloHertz to about 1 GHz, depending on the application. Because of this very wide frequency range, we generally turn to S-parameter based measurements. High performance simulators can directly incorporate the S-parameter component measurements in AC, DC, transient, and harmonic balance simulations while including the finite element PCB models.

While extremely useful, standard S-parameter measurements frequently aren’t sufficient. What’s really needed is an extended range, that is, a partial S2p measurement. I’ll explain why you need it and how to make this improved measurement.

S-parameters are a simple method of performing measurements over a very wide frequency range. The measurement is performed using a fixed resistance port rather than a high impedance probe. Two options are available for measuring impedance with S-parameters. One option is a reflection measurement and the other option is THRU measurement.

One port or two? Why partial?
The reflection, or 1-port, measurement is the simplest because it requires only one cable. But, it also requires a complex calibration, generally consisting of an OPEN calibration, a SHORT calibration, and a LOAD or MATCH calibration of the port used for the measurement. Most VNA’s (vector network analyzers) include the transformation from the S-parameter reflection measurement (S11 or S22) to impedance, but it’s quite simple. Using port 1 as an example, the reflection for a given reference impedance, Zref, (typically 50 Ω) the relationship between S11 and the device impedance is shown in Table 1.

Table 1. 1-Port Transformations

We can perform a 2-port measurement by placing the device to be measured either in series with or in shunt with the measurement ports. Table 2 shows the relationship between S21 and the device impedance for both the series and shunt configuration.

Table 2. 2-Port Transformations.

DC Ground Loop
An additional issue arises for the 2-port shunt-thru measurement due to a DC ground loop, which occurs as a result of the RF ground at the VNA and the series resistance of the interconnecting measurement cables. The Keysight E5061B VNA has a semi-floating input on the low frequency gain-phase ports, eliminating this DC ground loop for low impedance measurements up to 30 MHz. For the E5061B high frequency ports and other VNAs in general, the DC ground loop must be minimized using a common-mode coaxial transformer such as the Picotest J2102A. Otherwise, the low frequency measurements will be inaccurate.

The setup diagrams for these impedance measurement options are shown in Figure 1.

Figure 1. Basic Schematics for the 1-port and 2-port impedance measurements.

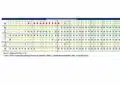
The simulations in Figure 2 show the S-parameter magnitude for each measurement technique as a function of the device impedance. All measurements lose sensitivity as the S-parameter magnitude approaches 1.0

Figure 2. S-parameter magnitude as a function of the device impedance.

Figure 3 shows a higher resolution view of the S parameter magnitude from 0.95 to 1.0.

Figure 3. Higher resolution view of the S-parameter magnitude as a function of the device impedance.

Setting the measurable S-parameter (either S11, S22 or S21) to a minimum of 40E-6 allows for a reasonable signal-to-noise margin and a maximum of 0.95. The ranges for each measurement are shown in Table 3.

Table 3. Measurement Impedance ranges.

Which range do we need?
Because we’re typically measuring VRMs, PDN’s (power distribution networks), capacitors, and inductors, the minimum impedance measurement is in the milliOhms range—whether it is inductor DCR (DC resistance), VRM output impedance, or capacitor ESR (equivalent series resistance). This requires the 2-port shunt measurement.

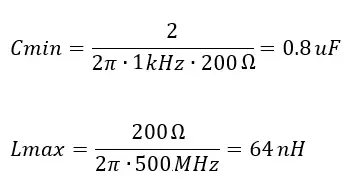
The measured S-parameter file must be valid for the complete simulation frequency range. Establishing the measurement range to be from 1 kHz to 500 MHz and using what I call the “realistic measurement range,” we can determine the maximum inductance or capacitance that can be measured using the 2-port shunt measurement.

Using the 2-port shunt measurement, the minimum capacitance that can be measured is 800 nF, precluding the measurement of high-frequency decoupling capacitors. The maximum inductance that can be measured at 500 MHz is only 60 nH. Even if the inductor is assumed to have a resonant frequency of 100 MHz, the maximum inductance that can be measured is less than 1 µH, precluding the measurement of ferrite beads and most output filter inductors.

Another issue arises in making this measurement. S21, S11, and S22 are all measuring the same device and therefore the same impedance range. As explained above, the S11 and S22 measurements fall below the range of the 1-port measurement. For example, while measuring an inductor, the DCR will be measured as S11 and S22. While measuring a capacitor, the ESR will be measured using S11 and S22. These 1-port terms will be invalid at low impedance levels typical of the devices. That’s why we need a “partial” 2-port thru measurement. We will only keep the S21 term and remove the S11 and S22 terms because they’re invalid at impedance levels below 0.5 Ω.

Some instruments allow saving the measurement as a Touchstone impedance file, which is a partial 2-port s-parameter file.

Extending the 2-port range
We can scale the measurement using series resistors, effectively increasing the port’s reference impedance. That lets us measure the decoupling capacitors and larger inductors. Figure 4  shows the results of this measurement.

Figure 4. Adding series resistors to extend the impedance range of the 2-port shunt measurement.

For example, adding a 450 Ω series resistor makes the reference impedance 500 Ω, shifting the measurement range up by a factor of 10. In some cases, the added series resistors can be accommodated by using an attenuating transmission line oscilloscope probe. Scaling factors of 1, 5, 10 and 20 are commercially available as 1-port probes. A pair of probes can be used to make a 2-port extended range measurement. The measurement range for various values of series resistors are shown in Table 4.

Table 4. Measurement Impedance ranges for various series resistor values.

The impedance transformation with the series resistors included is shown in Table 5.

Table 5. Impedance transformation including series resistors.

For measurements at either extreme of the measurement range, be sure to perform a full fixture removal calibration or full 1 port calibration on both parts as well as a THRU calibration. If series resistors are included, perform the THRU calibration with the series resistors included in the setup.A 0.1 µF ceramic capacitor is used as an example of the extended range two port impedance measurement. The results are shown up to 30 MHz in Figure 5. The impedance measurement spans the range of more than 1 kΩ and below the 9 mΩ ESR.

Figure 5. Measurement of a 0.1 µF capacitor with RS=200 Ω.

Higher frequency, low impedance measurements are very sensitive to even very small fixture inductance and at high frequency, high impedance measurements are very sensitive to even very small fixture capacitance. A smaller, 1 nF capacitor can eb measured at frequencies up to 1 GHz. Figure 6 shows the results.

Figure 6. The plot shows a measurement of of a 1 nF capacitor at frequenies up to 1 GHz. The resonance results from the capacitor ESL combined with the SMA connector capacitance of approximately 1 pF.

The 850 MHz resonance is the result of approximately 1 pF of excess capacitance from the low-quality SMA connectors. To accurately measure at these frequencies, we need better connectors and/or the excess capacitance needs to be calibrated out of the measurement.

Conclusion
The extended range technique and saving the S21 data only or a Touchstone Z data file provides a method of scaling the measurement to optimize the measurement window. Added benefits are that the extension resistors reduce the loading when measuring lower power VRM’s. This technique can also be used for measuring the output impedance of voltage references and closed loop op-amps and is supported by the Picotest non-invasive stability measurement as well.

Related

Recent Posts

Modeling and Simulation of Leakage Inductance

9.5.2025
1

Power Inductor Considerations for AI High Power Computing – Vishay Video

9.5.2025
4

TAIYO YUDEN Releases Compact SMD Power Inductors for Automotive Application

9.5.2025
1

Supercapacitors Emerge as a Promising Solution to AI-Induced Power Energy Spikes

6.5.2025
34

YAGEO Releases High Current SMD Common Mode Choke With Shape Core Construction

5.5.2025
21

Murata and NIMS Built New Database of Dielectric Material Properties

5.5.2025
44

Tariffs Crush Sales Sentiment in April 2025 ECST Results

5.5.2025
60

Solid State Polymer Multilayer Capacitors For High Temperature Application

2.5.2025
29

Graphene-Based BOSC Bank Of Supercapacitor Cells

2.5.2025
13

Hybrid Energy Storage System for Nanosatellite Applications

1.5.2025
9

Upcoming Events

May 14
11:00 - 12:00 CEST

Reliable RIGID.flex PCBs for Critical Applications – Made in Europe

May 14
17:00 - 17:30 CEST

Calculating Foil Winding Losses with AI

May 28
16:00 - 17:00 CEST

Power Over Data Line

View Calendar

Popular Posts

  • Buck Converter Design and Calculation

    0 shares
    Share 0 Tweet 0
  • Boost Converter Design and Calculation

    0 shares
    Share 0 Tweet 0
  • Tariffs Crush Sales Sentiment in April 2025 ECST Results

    0 shares
    Share 0 Tweet 0
  • Flyback Converter Design and Calculation

    0 shares
    Share 0 Tweet 0
  • What is a Dielectric Constant and DF of Plastic Materials?

    4 shares
    Share 4 Tweet 0
  • Dual Active Bridge (DAB) Topology Explained

    0 shares
    Share 0 Tweet 0
  • LLC Resonant Converter Design and Calculation

    0 shares
    Share 0 Tweet 0
  • SEPIC Converter Design and Calculation

    0 shares
    Share 0 Tweet 0
  • Ripple Current and its Effects on the Performance of Capacitors

    3 shares
    Share 3 Tweet 0
  • Physical Transformer Modelling in LTSpice

    0 shares
    Share 0 Tweet 0

Newsletter Subscription


Passive Components Blog

© EPCI - Leading Passive Components Educational and Information Site

  • Home
  • Privacy Policy
  • EPCI Membership & Advertisement
  • About

No Result
View All Result
  • Home
  • Knowledge Blog
  • Premium Suppliers

© EPCI - Leading Passive Components Educational and Information Site

This website uses cookies. By continuing to use this website you are giving consent to cookies being used. Visit our Privacy and Cookie Policy.
Go to mobile version