




Inductors are essential in power converters, filters, impedance-matching networks and many EMC countermeasures. However, a physical inductor does not retain ideal inductive behaviour across all frequencies: winding capacitance, winding resistance, core losses, terminals and PCB parasitics create resonances that can reshape an EMI spectrum and complicate compliance work.
This article expands on a presentation by Arturo Mediano of the University of Zaragoza, published by OMICRON Lab. It explains how to interpret an inductor’s wide-band impedance response, identify resonance-related EMI mechanisms, and include measured component behaviour in simulation.
Key Takeaways
- Real inductors display resonance beyond their nominal inductive behavior, affecting EMI performance.
- Measuring both impedance magnitude and phase is crucial for understanding an inductor’s resonance.
- The article explains how to assess inductor resonance and its relation to EMI in practical designs.
- Design considerations should include wide-band impedance behavior, phase response, and parasitic effects.
- Inductor resonance must be evaluated across relevant frequency ranges to ensure compliance with EMI standards.
Key features and benefits
- A real inductor has a limited frequency range in which it behaves predominantly as an inductor; above its first self-resonant frequency, its net behaviour becomes capacitive.
- The self-resonant frequency alone may not be sufficient for EMI assessment, because wound and cored inductors can show additional higher-order resonances.
- Measuring both impedance magnitude and phase helps distinguish inductive, resistive and capacitive operating regions.
- A broadband equivalent model based on measured data can reveal EMI mechanisms that an ideal-inductor simulation cannot predict.
- Resonance-related noise can couple into external cables as common-mode current, creating an efficient radiating structure even when the converter switching frequency is comparatively low.
- The same assessment approach can also be applied to transformers, common-mode chokes and other magnetic components.
Why real inductors resonate
An ideal inductor has an impedance that increases linearly with frequency, while its phase remains at 90 degrees. A practical inductor also includes DC winding resistance, frequency-dependent conductor loss, parasitic capacitance between turns, and losses associated with its magnetic core.
At low frequency, the resistance of the winding sets the lower limit of the impedance. Across the intended operating range, the inductor normally exhibits positive phase and inductive reactance. As frequency rises, parasitic capacitance becomes increasingly important and eventually interacts with the inductance.
The approximate first self-resonant frequency can be expressed as:
where L is the effective inductance and Cp represents effective parasitic capacitance. In a real component, these parameters and the associated losses are frequency dependent, so this equation should be treated as a first-order guide rather than a complete wide-band model.
At self-resonance, the phase passes through approximately zero degrees and the impedance is predominantly resistive. Above this point, the phase becomes negative and the component behaves increasingly like a capacitor. For this reason, an inductor selected only by nominal inductance, saturation current and DC resistance may be unsuitable in the frequency region that matters for EMC.
For an introduction to basic magnetic-component operation, see What Is an Inductor?.
Inductor impedance regions
| Frequency region | Dominant behaviour | Typical phase trend | Practical significance |
|---|---|---|---|
| Low frequency | Winding resistance and inductance | From near 0 degrees toward +90 degrees | DC resistance and low-frequency loss affect efficiency and thermal rise |
| Intended inductive range | Inductance dominates | Near +90 degrees | The inductor provides the intended energy-storage or filtering function |
| First self-resonance | Inductance and parasitic capacitance balance | Approximately 0 degrees | The component is predominantly resistive and no longer provides ideal inductive impedance |
| Above first resonance | Parasitic capacitance dominates | Toward -90 degrees | The inductor can provide an unintended capacitive coupling path |
| Higher-order resonances | Distributed winding, core, terminal and fixture effects | Multiple phase transitions possible | Narrowband or broadband impedance features can align with EMI-sensitive frequencies |
Higher-order resonances matter
A simple parallel RLC model can represent first self-resonance and is often useful at lower RF frequencies. However, power inductors and other wound magnetic components are distributed structures. Their windings, layers, terminals, magnetic material and package geometry can create additional resonant features well above the first self-resonant frequency.
These higher-order effects are important because converter noise contains significant high-frequency content beyond the nominal switching frequency. The spectral extent depends strongly on switching-node voltage transition rate, switching current transition rate, parasitic ringing, layout geometry and cable coupling.
An inductor may therefore be fully suitable at its switching frequency but still influence emissions at tens or hundreds of megahertz. The relevant question is not only whether the inductor’s nominal operating frequency is below its specified self-resonant frequency, but also whether its complete impedance profile contains features that coincide with an EMI peak.
How resonance becomes an EMI problem
A switched-mode converter produces repetitive voltage and current transitions. These transitions excite the circuit’s parasitic inductances and capacitances, including those of the inductor, semiconductor devices, PCB copper, heatsinks, connectors and cables.
A resonance can selectively increase spectral energy within a particular frequency band. That energy may remain within a local differential-mode loop, but it can also couple through stray capacitance or asymmetrical structures into common-mode current.
Common-mode current on an input or output cable is particularly important because the cable can act as an antenna. A small converter operating at several hundred kilohertz can therefore exhibit significant radiated-emission issues in the VHF range if parasitic resonances excite the connected cable system.
Buck-converter example
The OMICRON Lab presentation examines a simple 24 V-to-12 V buck converter operating at approximately 500 kHz with a 5 ohm load. The basic simulation uses an ideal inductor and predicts the expected switching-harmonic structure.
In the laboratory measurement, however, the switching-node spectrum and common-mode current measured on the input cable show a broad feature in approximately the 120 MHz to 300 MHz region. This frequency range is far above the converter’s nominal switching frequency, but it is consistent with high-frequency resonant behaviour and cable radiation mechanisms.
The measured 68 microhenry power inductor remains suitably inductive at 500 kHz. Its wide-band impedance measurement nevertheless reveals a significant additional resonance in the same high-frequency region where the converter measurement shows increased noise.
This example illustrates an important EMC lesson: a nominal switching frequency does not define the upper frequency limit of a converter’s EMI spectrum.
Measuring inductor resonance
Characterise inductors over a frequency range that covers both the intended operating region and the frequency range of the observed or expected EMI issue. Complex impedance measurement should include impedance magnitude and phase.
A frequency-response analyser, impedance analyser or vector network analyser with a suitable fixture can be used, provided that the measurement arrangement is appropriate for the target impedance and frequency range. In the referenced demonstration, a Bode 500 analyser measures the inductor from 10 Hz to 550 MHz.
Measurement priorities
- Measure impedance magnitude and phase; impedance magnitude alone cannot reliably identify whether the component is acting inductively or capacitively.
- Calibrate and compensate the measurement fixture before evaluating component behaviour.
- Keep leads, terminals and fixture geometry controlled, as they can introduce additional parasitic inductance and capacitance.
- Test the actual production component or a representative sample rather than relying exclusively on a generic model.
- Consider the effect of DC bias, AC excitation, temperature and mounting conditions, particularly for gapped ferrite, metal-composite and other nonlinear power inductors.
- Compare the frequency of impedance features with emission peaks seen in conducted-emission, current-probe, near-field or radiated-emission measurements.
- Use a suitable high-frequency probing method when measuring switching-node voltage; a long probe ground lead can substantially alter or exaggerate observed ringing.
From measurement to simulation
A wide-band component model provides a practical bridge between bench measurements and circuit-level EMI investigation. The goal is not necessarily to reproduce every minor impedance feature, but to represent the features relevant to the frequency band of concern.
The presentation demonstrates a circuit-fitting process that produces a SPICE-compatible model from the measured inductor response. The fitted network reproduces the measured impedance and phase more closely than an ideal 68 microhenry inductor.
When the fitted model replaces the ideal inductor in the buck-converter simulation, an additional broad spectral feature appears around the same high-frequency region observed in the laboratory test. This supports the correlation between the component’s resonance and the measured EMI behaviour.
Broadband modelling workflow
- Measure the impedance magnitude and phase of the actual inductor across the required frequency span.
- Identify the first self-resonance and any secondary impedance peaks, dips or phase transitions.
- Create or fit a passive equivalent circuit that reproduces the measured wide-band response.
- Validate the model against the original impedance and phase traces before using it in a converter simulation.
- Replace the ideal magnetic component in the circuit model with the fitted subcircuit.
- Compare the predicted spectral features with switch-node voltage, cable current, conducted-emission or radiated-emission measurements.
- Use the validated model to evaluate damping, layout and component changes before committing to a PCB revision.
Application fit
| Application | Resonance-related concern | Useful engineering check |
|---|---|---|
| Buck and boost converters | Output-inductor and PCB parasitics can create high-frequency noise peaks | Compare inductor impedance features with switch-node and cable-current spectra |
| PFC stages | High current, magnetic-field coupling and fast switching can contribute to conducted and radiated noise | Characterise the boost inductor and verify the high-frequency input-filter response |
| Input EMI filters | Differential-mode inductors and common-mode chokes have finite useful impedance bandwidth | Review impedance and phase over the targeted attenuation band |
| Flyback and forward converters | Leakage inductance, transformer capacitance and clamp networks interact | Identify resonant ringing and assess its common-mode coupling path |
| RF and matching networks | Component parasitics set usable frequency range and detune network response | Use manufacturer RF models or measured S-parameters where available |
| Motor drives and inverters | Fast switching transitions can excite cable and filter resonances | Evaluate cable length, common-mode current and filter performance together |
Design-in notes for engineers
- Select for the full frequency problem, not only nominal inductance. Review inductance, DC resistance, current rating, core-loss behaviour, impedance-versus-frequency data, phase data and self-resonant frequency where available.
- Use adequate frequency margin. Avoid operating close to a resonance that could reduce filtering effectiveness or create an unintended coupling path. Also investigate higher-order resonances if the product must meet emissions limits above the first self-resonant frequency.
- Minimise switching-node coupling. Keep switch-node copper areas compact and away from sensitive signals, connectors, cable interfaces, heatsinks and chassis structures that may create capacitive common-mode paths.
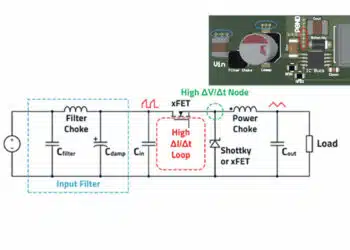
- Control high-di/dt loops. Place input ceramic capacitors close to the switching devices and minimise loop area in the input commutation path. This reduces parasitic inductance and the voltage overshoot that can excite resonances.
- Treat PCB layout as part of the magnetic system. The inductor, its pad geometry, nearby planes, copper pours and output capacitor form a coupled RF structure, not isolated schematic symbols.
- Use damping intentionally. A snubber, ferrite bead, gate-resistance change or lossy damping network can reduce resonance amplitude, but must be validated for efficiency, temperature rise, transient behaviour and control-loop stability.
- Measure common-mode current early. A current probe around an input or output cable can identify whether an emission problem is associated with cable-driven common-mode radiation.
- Validate at realistic conditions. Core permeability, inductance and losses can change with current and temperature. Final decisions should be confirmed under representative input voltage, load, temperature and switching conditions.
- Assess alternatives by construction as well as rating. Two inductors with the same nominal inductance and current rating can have substantially different winding capacitance, shielding, resonance behaviour and EMI performance.
For broader converter context, see Buck Converter Design and Calculation.
Practical debugging checklist
- Does the measured emission peak coincide with the inductor’s first or higher-order resonance?
- Does the impedance phase indicate that the component is inductive, resistive or capacitive at the affected frequency?
- Does the peak move when switching-edge rate, gate resistance, load current or input voltage changes?
- Is the same frequency region visible in switching-node ringing, near-field scans and cable common-mode current?
- Does replacing the inductor with a part of different construction shift or reduce the peak?
- Can a wide-band fitted model reproduce the spectral feature in simulation?
- Does a proposed mitigation reduce the issue without creating a new peak elsewhere in the compliance band?
- Are the resulting thermal, efficiency, transient and stability margins still acceptable?
Conclusion
Inductor resonance is not only a component-level curiosity but a practical EMC design issue. A real inductor may meet its nominal inductance target at converter switching frequency while still introducing impedance features at much higher frequencies that shape conducted or radiated EMI.
For that reason, inductor selection should include wide-band impedance behaviour, phase response, parasitic effects and layout interaction—not only nominal inductance, DCR and current rating. Measuring the actual component, correlating resonance features with converter EMI results, and using a fitted broadband model can significantly improve debugging efficiency and first-pass design success.
FAQ
It is the frequency at which the inductor’s inductive reactance and parasitic capacitance balance each other, so the component is no longer predominantly inductive and begins to behave capacitively.
Fast switching edges, PCB parasitics, magnetic-component parasitics and cable coupling generate and shape spectral energy far above the nominal switching frequency.
Impedance magnitude alone does not show whether the part behaves inductively, resistively or capacitively at a given frequency. Phase helps identify the actual operating region.
Yes. Winding structure, shielding, core material, parasitic capacitance, terminal geometry and package construction can significantly change wide-band behaviour.
How to evaluate an inductor for EMI-sensitive designs
- Define the converter operating point, switching frequency and relevant compliance band.
- Measure or obtain impedance-versus-frequency and phase-versus-frequency data for the actual inductor.
- Identify the first self-resonance and any higher-order resonant features.
- Compare these features with observed switch-node ringing, conducted-noise peaks or cable common-mode current.
- Validate behaviour in simulation using a broadband fitted model if available.
- Check whether layout changes, damping or an alternative inductor construction improve the result.
- Confirm final performance under realistic voltage, current and temperature conditions.
References
- Inductor Resonances and Electromagnetic Interference (EMI) – OMICRON Lab YouTube video
- OMICRON Lab Tutorials – official channel
Further reading
- What Is an Inductor?
- Buck Converter Design and Calculation
- Causes of Oscillations in Flyback Converters
- Why Power Inductors Use a Ferrite Core With an Air Gap
Source
This article is based on the OMICRON Lab educational presentation by Arturo Mediano, University of Zaragoza. The presentation illustrates wide-band impedance measurement, component-model fitting and correlation of inductor resonance with converter EMI behaviour; engineers should consult current manufacturer datasheets, application documentation and validated in-system measurements before final component qualification and design release.