


Source: EDN blog
by Kenneth Wyatt, president and principal consultant of Wyatt Technical Services.
The development of stealth aircraft brought about the use of ferrite absorber sheets, which have proven useful for damping cavity resonances at microwave frequencies. Since then, ferrite absorber sheets have become useful at mitigating EMI. Most absorber sheets act as magnetic shields that help “redirect” magnetic fields and become effective at gigahertz frequencies. As my measurements show, some are effective even at much lower frequencies, serving as shielding or absorbers for high-frequency EMI from clock harmonics in the hundreds of megahertz.
I’ve used these absorbers for my EMC clients to help shield or absorb harmonic energy in the GHz frequencies. One client had transmitter high-order harmonics well into the gigahertz band and I found the absorber, when placed under the circuit board, reduced the harmonics by 8 dB to 14 dB between 2 GHz to 6 GHz. More often, however, I need something effective in the LTE cellular frequency range of 700 MHz to 900 MHz and it seems few absorber materials are very effective in this range. I needed a quick way to characterize the many absorber materials I had at hand.
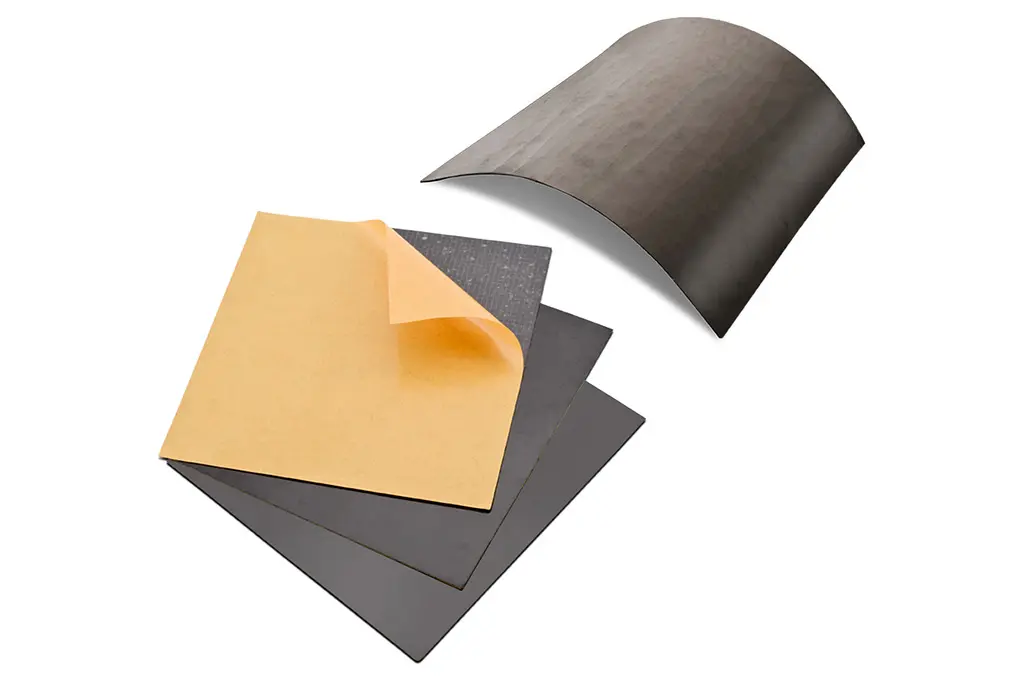
Unfortunately, manufacturers of these materials rarely show the absorptive properties versus frequency, but rather the permeability curves. While higher permeability materials usually mean better shielding at lower frequencies, EMC engineers are more interested in specific absorption (in dB) versus frequency, such information makes it easier to specify the correct material, depending on the application. I’ve made these measurements and present my results here. Figure 1 shows the tested samples.

Figure 1. Measurements for insertion loss covered a variety of ferrite absorber sheets. Photo by Kenneth Wyatt.
Würth Elektronik has a useful application note, ANP022, “Selection and Characteristics of WE-FSFS (Flexible Sintered Ferrite Sheet)” that shows a simple measurement technique for determining the insertion loss versus frequency. Using this technique, I was able to test the samples in less than one hour.
The overall test setup was simple, requiring only a spectrum analyzer with tracking generator (Siglent SSA3032X) and a 50-Ω microstrip transmission line (Figure 2).

Figure 2. The test setup showing the spectrum analyzer and tracking generator connected to each end of the 50-Ω transmission line. Photo by Kenneth Wyatt.
Once the transmission line is normalized, we merely place and hold the sample absorber on top of the microstrip. Generally, I measured from 100 MHz to 3.2 GHz (the upper limit of my analyzer). I always made sure there was the tear-off plastic strip against the microstrip, rather than the raw ferrite. See Figure 3.

Figure 3. Example of an absorber measurement. Each sample was simply held down against the microstrip. Photo by Kenneth Wyatt.
Placing the absorber on top of the microstrip will absorb an increasing amount of magnetic flux as frequency is increased. This will be indicated by the increase in insertion loss in the display. I suspect the loss will increase as the sample size is increased, but didn’t explore that aspect in detail.
Samples were tested from 3M, Arc-Tech, Chomerics, NEC/Tokin, and Würth Elektronik. Specific part numbers are within the captions below. Listed in alphabetical order. Figure 4 covers 3M while figures 5, 6, and 7 show results for Arc-Tech. Page 2 covers materials from Parker Chomerics, NEC, and Würth Elektronik.

Figure 4. Insertion loss for 3M P/N CN-3190 (yellow) and AB50105 (violet). Sample size: 7.5×8 cm and 10.5×14.5 cm, respectively.

Figure 5. Arc-Tech’s WAVE-X P/N LS10055 (yellow). Sample size: 15×15 cm.

Figure 6. Arc-Tech’s WAVE-X P/N SB1007040 (yellow) and SB1007020 (violet). Sample size: 15×15 cm.

Figure 7. Arc-Tech’s WAVE-X P/N WXA10 (yellow) and WXA20 (violet). Sample size: 15×15 cm.
The Arc-Tech WX-A series had excellent insertion loss of 10 to 40 dB above 1 GHz and should prove useful for applications in the cellular, GPS, and 2.4 GHz Wi-Fi bands.

The Chomerics material is unique in that it has substantial absorption properties starting around 20 MHz and increasing to 20 dB insertion loss above 1 GHz. As you can see, I had to greatly expand the frequency span to capture the whole picture.
Figure 9 and Figure 10 look at products from NEC.

Figure 9. NEC P/N EFR(01) (yellow), FK2(03) (violet), and R4N(01) (blue). Sample size: all 8×8 cm.

Figure 10. NEC P/N R4N(04) (yellow), and K4E(05) (violet). Sample size: all 8×8 cm.
Generally, materials from Würth Elektronik are more effective in the higher gigahertz frequency bands. See Figure 11 for an example frequency plot from the company’s application note.

Figure 11. Insertion loss versus frequency for the typical Würth Elektronik “WE-FSFS” samples. Figure courtesy of Würth Elektronik.
Note that this set of curves extends out to 6 GHz, but yields just a nominal 3 dB to 9 dB insertion loss at that extreme. This is actually pretty typical for most of the absorber material I measured, where they are most useful in the higher GHz frequencies.

Figure 12. Würth Elektronik P/N 354001 (yellow), 354002 (violet), and 354003 (blue). Sample size: all 12 x 12 cm. These are approaching 8 to 10 dB insertion loss at 3 GHz.

Figure 13. Würth Elektronik P/N 354004 (yellow), 354005 (violet), and 354006 (blue). Sample size: all 6×6 cm.

Figure 14. Würth Elektronik P/N 364001 (yellow), 364002 (violet), and 364003 (blue). Sample size: all 12×12 cm. These are approaching 6 dB to 8 dB insertion loss at 3 GHz.

Figure 15. Würth Elektronik P/N 364004 (yellow), 364005 (violet), and 364006 (blue). Sample size: all 6×6 cm.
- Würth Elektronik Applications Note ANP022, Selection and Characteristics of WE-FSFS
- Würth Elektronik, Trilogy of Magnetics (5th Edition)
- IoT: The Interference of Things, Martin Rowe, EDN
- Platform interference, Kenneth Wyatt, EDN