Passive Components Blog
No Result
View All Result
  • Home
  • NewsFilter
    • All
    • Aerospace & Defence
    • Antenna
    • Applications
    • Automotive
    • Capacitors
    • Circuit Protection Devices
    • electro-mechanical news
    • Filters
    • Fuses
    • Inductors
    • Industrial
    • Integrated Passives
    • inter-connect news
    • Market & Supply Chain
    • Market Insights
    • Medical
    • Modelling and Simulation
    • New Materials & Supply
    • New Technologies
    • Non-linear Passives
    • Oscillators
    • Passive Sensors News
    • Resistors
    • RF & Microwave
    • Telecommunication
    • Weekly Digest

    October 2025 Interconnect, Passives and Electromechanical Components Market Insights

    Exxelia 4-Terminal Safety Capacitors Compliant with NF F 62-102 Railway Standard

    Wk 43 Electronics Supply Chain Digest

    Samsung Releases Automotive Molded 2220 1kV C0G MLCC

    How to Select Ferrite Bead for Filtering in Buck Boost Converter

    VINATech Offers Smallest 100µF Al-Hybrid Capacitor

    Vishay Unveils SMD 1200V PTC Thermistors in Compact Size

    Power Inductors Future: Minimal Losses and Compact Designs

    Bourns Unveils Automotive 3 Watt Gate Driver Transformer

    Trending Tags

    • Ripple Current
    • RF
    • Leakage Current
    • Tantalum vs Ceramic
    • Snubber
    • Low ESR
    • Feedthrough
    • Derating
    • Dielectric Constant
    • New Products
    • Market Reports
  • VideoFilter
    • All
    • Antenna videos
    • Capacitor videos
    • Circuit Protection Video
    • Filter videos
    • Fuse videos
    • Inductor videos
    • Inter-Connect Video
    • Non-linear passives videos
    • Oscillator videos
    • Passive sensors videos
    • Resistor videos

    How to Select Ferrite Bead for Filtering in Buck Boost Converter

    Power Inductors Future: Minimal Losses and Compact Designs

    Percolation Phenomenon: Degradation of Molded Power Inductors in DC/DC Converters

    Connector PCB Design Challenges

    Efficient Power Converters: Duty Cycle vs Conduction Losses

    Ripple Steering in Coupled Inductors: SEPIC Case

    SEPIC Converter with Coupled and Uncoupled Inductors

    Coupled Inductors in SEPIC versus Flyback Converters

    Non-Linear MLCC Class II Capacitor Measurements Challenges

    Trending Tags

    • Capacitors explained
    • Inductors explained
    • Resistors explained
    • Filters explained
    • Application Video Guidelines
    • EMC
    • New Products
    • Ripple Current
    • Simulation
    • Tantalum vs Ceramic
  • Knowledge Blog
  • Suppliers
    • Who is Who
  • PCNS
    • PCNS 2025
    • PCNS 2023
    • PCNS 2021
    • PCNS 2019
    • PCNS 2017
  • Events
No Result
View All Result
Passive Components Blog
No Result
View All Result

Filter Q Factor Explained

18.12.2024
Reading Time: 10 mins read
A A

This blog article from Knowles Precision Devices perform a deep dive on the different ways you can think about Q factor for the components going into filter or filter as a whole. 

As an RF engineer, you likely frequently hear the term “quality factor”, or Q factor, used as shorthand figure of merit (FOM) for RF filters.

RelatedPosts

Knowles Releases High Q Non-Magnetic X7R MLCCs for Medical Imaging

Knowles Unveils High-Performance Safety-Certified MLCC Capacitors

Knowles Releases Inductors for Mission-Critical RF Applications

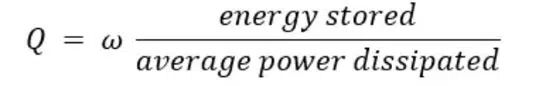
In short, Q factor is expressed as the ratio of stored versus lost energy per oscillation cycle.

 More specifically, Q factor generally describes specifications such as the steepness of skirts, or the selectivity, and how low the insertion loss is. Overall losses through a resonator increase as Q factor drops and will increase more rapidly with frequency for lower values of resonator Q.

However, truly understanding how Q factor is determined is a bit more intricate. Let’s start by looking back to the example bandpass filter specification we showed in this article.

Figure 1. An example of a typical bandpass filter response.

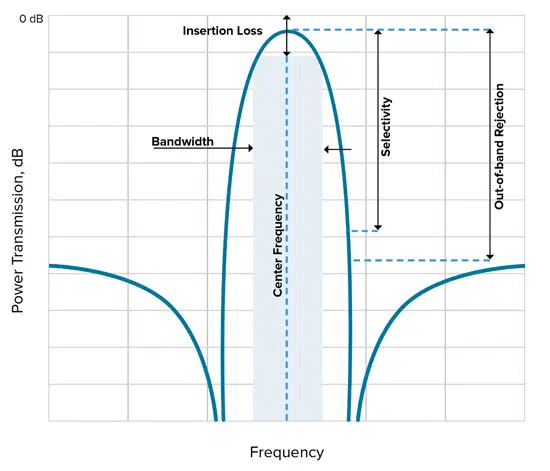
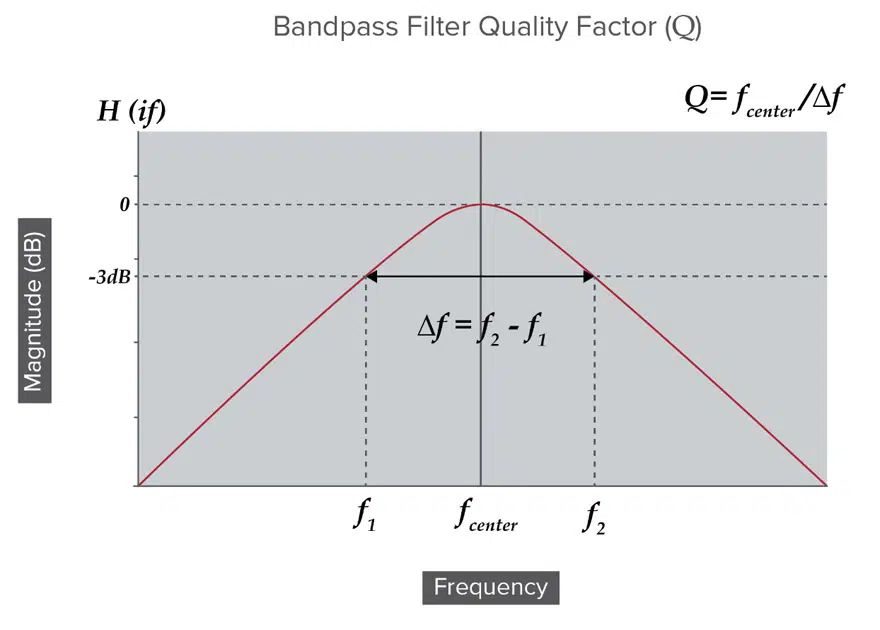
In this example, the X axis shows the operating frequency of the bandpass filter while the Y axis shows the power allowed through the filter in decibels. We can mark the following characteristics of this filter on this graph: 

  • Center frequency – The geometric or arithmetic mean of the upper and lower cutoff frequencies or 3dB points of the bandpass filter.
  • Bandwidth – Usually taken from the 3dB points on either side of the center frequency.
  • Insertion loss – Drawn here as the loss at the center frequency. In general, when someone says high Q in reference to insertion loss, this usually means low insertion loss.
  • Selectivity – This is a measurement of a filter’s ability to pass or reject specific frequencies closer to the band of interest. This is what people usually mean when they talk about ‘steep skirts’ or a ‘sharp response.’ Generally, high Q means high selectivity.

Understanding the Different Components of Q Factor

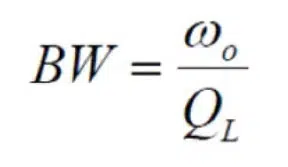
There are three types of Q – loaded (QL), unloaded Q (Qu), and external Q (Qe) that make up Q factor. QL is measured by looking at a plot of a filter’s performance. The standard definition of QL is as a FOM for bandwidth calculated with the following equation:

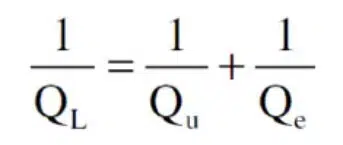
QL is driven by what goes on inside the filter, which is the Qu, and the way that the device is coupled to the external world, which is the Qe:

In general, QL is a convenient way to talk about a filter’s performance as plotted. But when it comes to what makes a filter work the way it does, it’s best to look at the QU of the resonators the filter is built up from. Now let’s look more specifically at three different ways to define Q factor using the different types of Q.

Three Ways to Define Q Factor

As mentioned, there are actually a few different ways to define Q factor, depending on the context of the discussion. This includes the following:

  • Bandpass Q Factor – This talks about the width of a filter. Sometimes this is QL ,as discussed above, but with wide filters it is tricky to use Bandpass Q Factor
  • Component Q Factor – Addresses individual inductor or capacitor Q
  • Pole Q Factor – Tells us about the performance of different parts of a filter response, and is more abstract and based on Pole Zero Plots

While component and bandpass Q are the two most common types of Q factor referenced, let’s further explore the context of all three to better understand what someone may mean when they say a filter or component has “high Q.”

Bandpass Q Factor

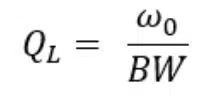
When connecting components to create a resonant circuit, we need to look at QL, which for bandpass filters is referring to selectivity as shown in Figure 2.

Figure 2. A graph showing bandpass filter Q Factor.

If the resonant circuit has Bandpass properties, we can define QL with the following formula:

It is important to note that this approach works for narrowband filters. However, when f1 and f2 are widely separated, which usually means two octaves or more between f1 and f2, this results in a wideband with the filter often constructed by combining a high pass filter for f1 and a low pass filter for f2. In this situation it might make sense to think about the pole quality factor instead, which we will discuss later in this post, or to look at the performance of the high pass and low pass sections and look at their QL. 

Component Q Factor

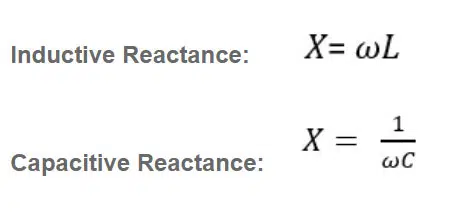
As mentioned, component Q factor looks at just the component, such as the inductor or capacitor, in isolation from the rest of the circuit. Components have Qu related to the component values and loss. Since inductance and capacitance provide an opposition to AC that is measured in terms of reactance, let’s look at Q in terms of how the component behaves under reactance.

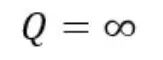
For a reactance with no loss: 

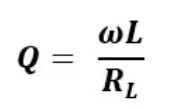
For an Inductive reactance, Q increases with frequency and decreases with loss:

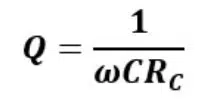
For capacitive reactance, Q decreases with frequency and with loss:

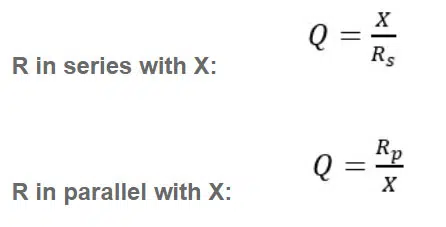
More specifically, the Q of an individual reactive component depends on the frequency at which it is evaluated, which is typically the resonant frequency of the circuit that it is used in. The formula for Q depends on whether we imagine the R to be in series with or in parallel with the reactance. The following formulas can be used to calculate Qu: 

Pole Q Factor

For more complex system such as wider filters, we can look at the pole Q factor, which tells us about the performance of different parts of the filter response. A filter has a transfer function H(s) which tells us what an output signal will look like for a given input signal.

Filter Transfer Functions are expressed in terms of the complex variable ‘s’ because some problems are much easier so solve in the Laplace domain than they are in the time domain. The output signal Y(s) can be converted back into real numbers, and we can see how a filter’s performance is determined by the structure of the transfer function H(s). We can find the values for s for when the transfer function either gets large because the denominator heads to zero, or gets small because the numerator heads to zero.

When heads to zero we call these values of s ‘zeros’ because the transfer function tends to get smaller. When heads to zero we call these values of s “poles” because the transfer function tends to get larger. In the Pole Zero Plot in Figure 3, you can see that the poles are marked with an X.

Figure 3. A Pole Zero Plot that shows Pole Q factor.

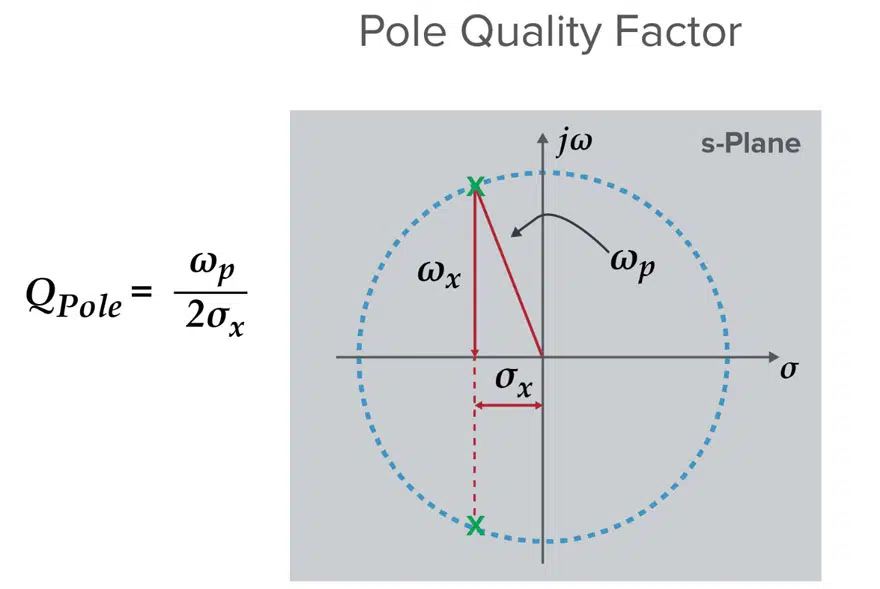
In this plot there are two poles that are complex conjugate pairs. The length of the arrow from the origin to the X is the frequency ωp. The distance along the real axis can be written in terms of the Q factor: 

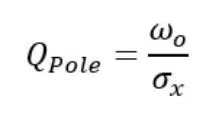
Poles and zeros come from analyzing the system as a whole. Poles close to the y axis enhance amplitude response, making that part of the filter “sharp,” which is one of the ways Q factor drives selectivity. Additionally, based on this plot, high Q for a pole means low sigma. Since earlier we said this real component has to do with damping, which in turn is related to energy loss of a resonator, this makes sense. 

Related

Source: Knowles Precision Devices

Recent Posts

How to Select Ferrite Bead for Filtering in Buck Boost Converter

23.10.2025
32

Power Inductors Future: Minimal Losses and Compact Designs

22.10.2025
37

Percolation Phenomenon: Degradation of Molded Power Inductors in DC/DC Converters

21.10.2025
38

High Energy Density Polymer Film Capacitors via Molecular and Interfacial Design

15.10.2025
27

Over-Voltage Protection Clippers, Clampers, Snubbers, DC Restorers

13.10.2025
35

Silicon Capacitors Market: Shaping the Foundation for Next-Gen Miniaturization Electronics

10.10.2025
82

Enhancing Energy Density in Nanocomposite Dielectric Capacitors

9.10.2025
41

Advances in the Environmental Performance of Polymer Capacitors

8.10.2025
68

Benefits of Tantalum Powder Stress–Strain Curve Evaluation vs Conventional Wet Test

3.10.2025
27

Electrolyte Selection and Performance in Supercapacitors

3.10.2025
46

Upcoming Events

Oct 28
8:00 - 15:00 CET

Power Up Your Design: SN6507 and the Ready-to-Use Development Kit

Oct 30
11:00 - 12:00 CET

Space Ceramic Capacitors with Flexible Testing

Nov 4
10:00 - 11:00 PST

Design and Stability Analysis of GaN Power Amplifiers using Advanced Simulation Tools

View Calendar

Popular Posts

  • Buck Converter Design and Calculation

    0 shares
    Share 0 Tweet 0
  • Boost Converter Design and Calculation

    0 shares
    Share 0 Tweet 0
  • Flyback Converter Design and Calculation

    0 shares
    Share 0 Tweet 0
  • LLC Resonant Converter Design and Calculation

    0 shares
    Share 0 Tweet 0
  • Ripple Current and its Effects on the Performance of Capacitors

    3 shares
    Share 3 Tweet 0
  • What is a Dielectric Constant and DF of Plastic Materials?

    4 shares
    Share 4 Tweet 0
  • SEPIC Converter Design and Calculation

    0 shares
    Share 0 Tweet 0
  • Dual Active Bridge (DAB) Topology

    0 shares
    Share 0 Tweet 0
  • MLCC and Ceramic Capacitors

    0 shares
    Share 0 Tweet 0
  • Flying Capacitors

    0 shares
    Share 0 Tweet 0

Newsletter Subscription


Passive Components Blog

© EPCI - Leading Passive Components Educational and Information Site

  • Home
  • Privacy Policy
  • EPCI Membership & Advertisement
  • About

No Result
View All Result
  • Home
  • Knowledge Blog
  • PCNS

© EPCI - Leading Passive Components Educational and Information Site

This website uses cookies. By continuing to use this website you are giving consent to cookies being used. Visit our Privacy and Cookie Policy.
Go to mobile version