


This article explain in depth impact of magnetic field and how to effectively shield it. The post is based on Würth Elektronik‘s “Reference Guide ABC of Shielding” that can be ordered from WE website here. Published under permission by Würth Elektronik.
Magnetic field interferences are becoming increasingly prevalent in electronic devices due to the reduced distance between printed circuit boards (PCBs), integrated circuits (ICs), and other sensitive components.
This phenomenon is further exacerbated by the widespread adoption of magnetic coupling communication technologies for power and data transfer, such as Qi-WPC, NFC, RFID, PMA, A4WP, and WCT.
Ferromagnetic materials possess the unique ability to manage magnetic flux, thereby enhancing the efficiency of power transfers, improving the reliability and extending the distance range of data communications, and mitigating undesired magnetic noise couplings.
Moreover, their capacity to absorb electromagnetic waves and convert noise into heat addresses other EMI issues, including transmission line interferences and cavity resonance effects, within electronic devices.
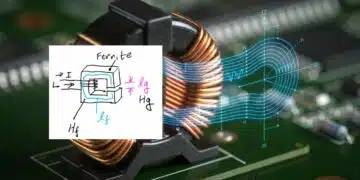
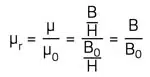
In the context of radio frequency (RF) communication and electromagnetic interference suppression, ferrite materials play a crucial role in redirecting magnetic fields. When placed in a magnetic field (H), ferrite materials exhibit the remarkable ability to concentrate the magnetic flux. This concentration is quantified by the relative permeability, which is defined as the ratio of the magnetic flux density to the magnetic intensity. The relative permeability is also commonly referred to as the Permeability of the Medium.
Where,
- µ: Magnetic permeability (scalar quantity, H/m)
- B: Magnetic flux density (vectorial, T)
- H: Magnetic field strength (vectorial, A/m)
The relation between the magnetic permeability and the magnetic field strength is:
B = µ · H
µ is the magnetic permeability and can be express with relation to the magnetic permeability of air as follows:
µ = µ0 · µr
Whereas µ0 is the permeability of free space and equal to 4π · 10-7 H/m ≈ 12.57 · 10-7 H/m. The formula of permeability of free space, a vacuum or air is:
µ0 = B0 / H
This means, µ0 is the ratio of magnetic flux density B0 and magnetizing field H through it.
Relative permeability µr is the comparison of the permeability of the medium to air and can be expressed by:
µr = µ / µ0
Where,
- µr: Relative permeability of the material (medium)
- µ: Permeability of the material (medium)
- µ0: Permeability of air
With this we can calculate:
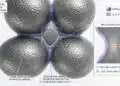
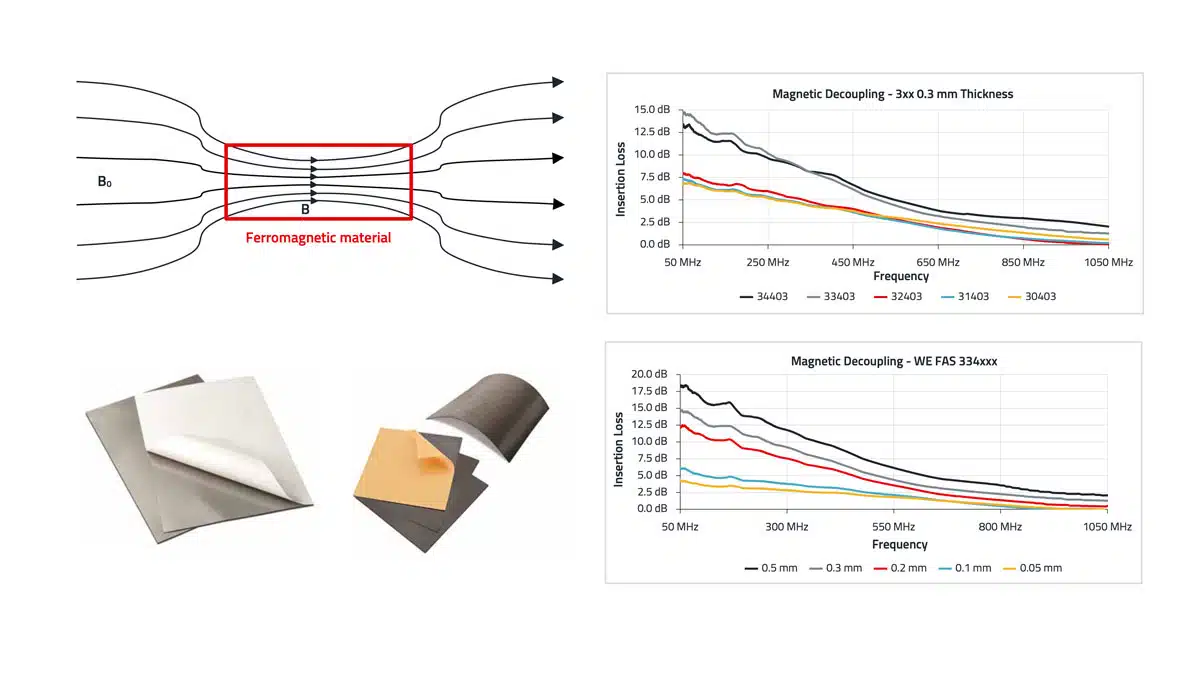
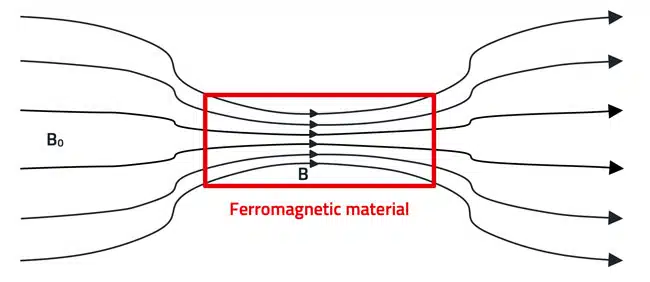
Permeability is the property of concentrating the magnetic flux lines as shown in Figure 1. The higher the value µr, the greater the concentration.
Due to the unique property of relative magnetic permeability of ferrite materials, components made of these materials can be manufactured in such a way that they have different electrical properties depending on the frequency. The relative permeability µr of the material is a complex parameter:
µr = µ’ – j · µ’’
The complex part of the permeability, denoted as j · µ’’ , represents the resistive component, while the real part, µ’ , signifies the reactive component (reactance XL). The proportions of these components vary depending on the mixing ratio of the raw materials and the manufacturing processes. Consequently, ferrite materials can exhibit a wide range of impedance properties.
Ferrite materials with a high resistive component, µ” , are particularly useful in handling RF-noise. This is because the energy generated by eddy currents and hysteresis losses can be converted into heat. On the other hand, high µ’ is required to guide and concentrate the magnetic flux within the ferrite material. Both µ’ and µ” are frequency-dependent, so the appropriate material must be chosen to operate within the specified frequency range of the application.
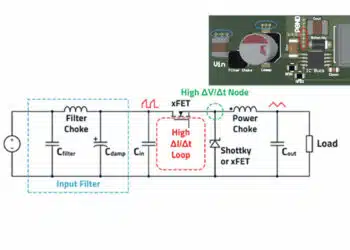
Near-field and wireless power communication technologies pose challenges in terms of efficiency and shielding. These technologies utilize magnetic coupling for short-range communication, often operating in environments surrounded by highly integrated electronic circuitry where space and weight are limited. While classic conductive shields can effectively protect against undesired noise couplings by generating an opposing field, they significantly reduce the efficiency of the desired transmission.
The optimal solution involves concentrating the magnetic field only where it is required, thereby safeguarding the surroundings and enhancing efficiency. To achieve this, materials with high µ’ and low µ” at the communication frequency are essential.
Magnetic Shielding Sheets
Two distinct magnetic shielding sheets are described below.
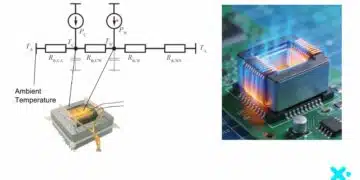
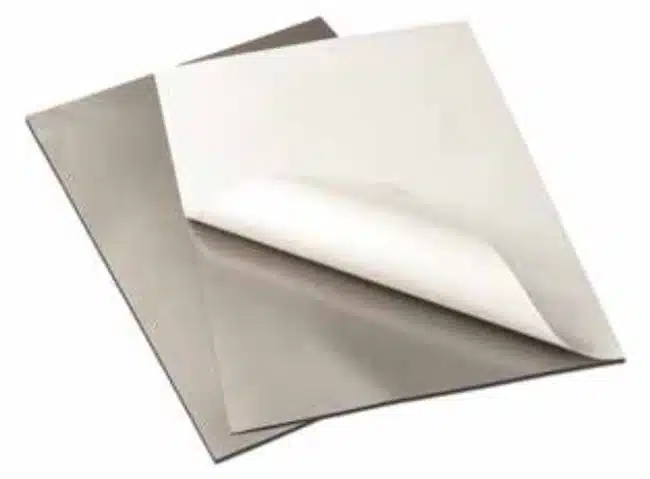
Flexible Absorber Sheet
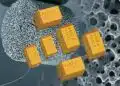
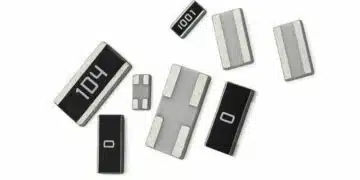
Example in Fig.2. is a composite material (WE reference WE-FAS) is formed by a polymer filled with ferrite powder. It offers high flexibility, but their magnetic properties are reduced because of the polymer. Their µ” extends up to a frequency of several gigahertz and they are also able to attenuate the electrical field, so they are a good option for high frequency EMI reduction.
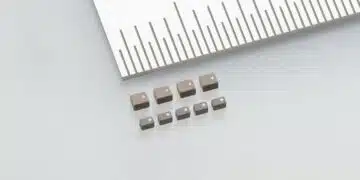
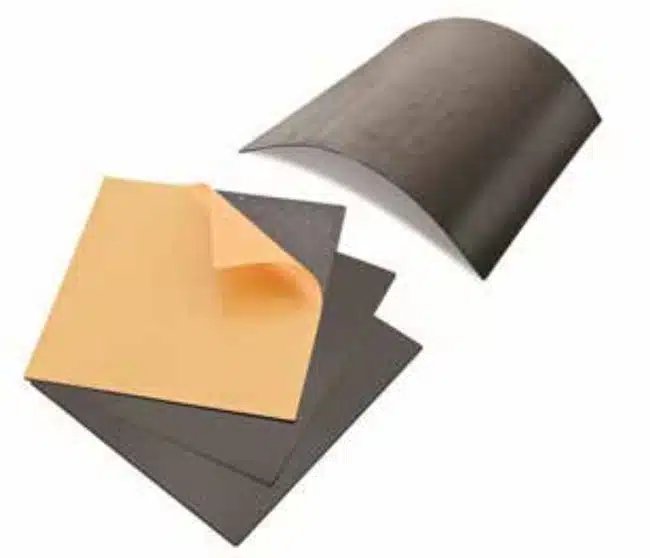
Flexible Sintered Ferrite Sheet
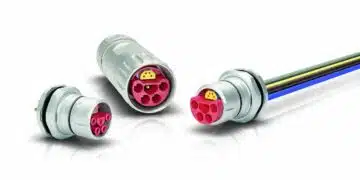
This line of materials as shown on Fig. 3. (WE reference WE-FSFS) provides high permeability and low losses with very low thickness (starting at 0.1 mm). They are composed by pre-cracked thin ferrite plates placed between a layer of adhesive tape and a PET cover layer that provides protection, high surface resistivity, and insulation on both sides. They are an ideal option for magnetic flux management.
Characterization of Magnetic Shielding Sheets
Permeability
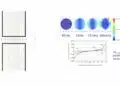
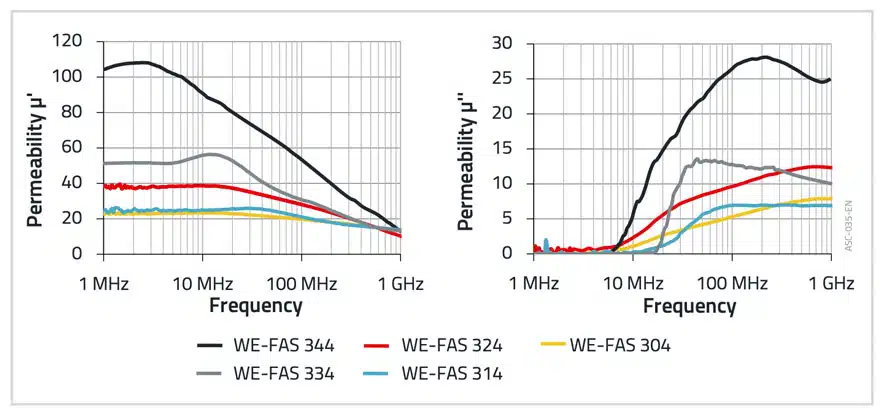
One of the most crucial parameters that characterize a material’s ability to absorb electromagnetic noise is the complex magnetic permeability (µ). The behavior of a magnetic shielding sheet varies depending on the material composition and the frequency. Therefore, it’s crucial to determine the frequency range where the noise appears and its corresponding field strength within that range. With this information, it’s possible to strike a balance between reflection (µ’) and magnetic losses (µ’’), depending on the application and the type of electromagnetic noise. Figure 4. illustrates µ’ and µ” values for various WE EMI flexible absorber magnetic shielding sheets.
Nevertheless, in certain cases, estimating the magnetic shielding performance of a sheet can be challenging because it depends on more factors than just its permeability. These additional factors include the distance between the noise source and the magnetic shielding sheet, the sheet’s thickness, size, and the geometry of the area to be shielded. Consequently, in basic systems, the attenuation of a specific magnetic shielding sheet can be estimated.
However, for studying its noise reduction in a complex electronic system, it is often more advantageous to adopt a real-world approach. In specific applications, it would be more intriguing to measure the absorbing capability through experimental setups that enable the evaluation of the material’s performance by comparing multiple sheets exhibiting different behaviors. Consequently, several experimental tests are presented to characterize the absorber material based on its internal and external properties.
The characterization techniques described simulate specific problems related to transmission lines, such as cavity resonance and magnetic decoupling. These setups and experimental results will be discussed below to determine which material offers the most effective performance in reducing electromagnetic noise issues, depending on the application.
Transmission Loss (Microstrip Line Method)
This technique enables the evaluation of the performance of magnetic shielding sheets in systems with transmission line issues through an experimental procedure. By trying various sheets with different compositions or thicknesses, it’s possible to achieve the maximum transmission attenuation power ratio in a specific application.
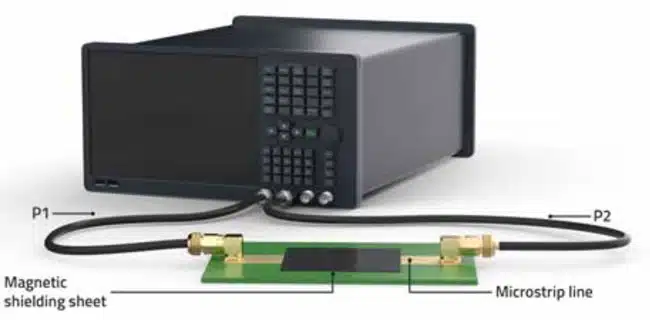
A method based on a microstrip line (MSL) test fixture is used to assess the attenuation of conducting current noise in a printed circuit board (PCB) or noise path when a magnetic shielding sheet is installed. The MSL serves as a transmission line, providing the noise that will be measured to determine the sample’s absorption ability. This test fixture simulates a noise source within an electronic circuit, allowing for the determination of the transmission absorption.
The manufactured MSL employed in this procedure consists of a PCB where the strip conductor is printed and two SMA type connectors are connected in both ends. The MSL is based on the IEC 62333 part 2 standard. The absorbing ratio can be determined by comparing the transmission line power ratio before and after installing the magnetic shielding sheet sample on the test fixture. To conduct the measurements, the coaxial cables from a network analyzer are connected to the SMA test fixture ports (P1 and P2), as illustrated in Figure 5. The network analyzer must be configured to function as both a signal source and signal receiver by measuring the S21 parameter.
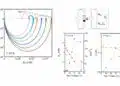
The results presented in Figures 6. and 7. are the outcomes of analyzing the acquired data by experimenting with various materials of the same thickness within the WE-FAS series. Additionally, the generated transmission loss of the WE-FAS 3441 family is also depicted as a function of the sheet thickness. This analysis enables us to assess the magnetic shielding sheet’s performance based on its composition and thickness.
Reflection Loss (Coaxial Line Method)
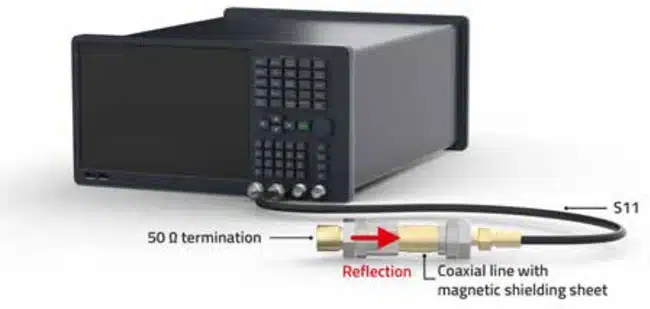
The coaxial line experimental method offers a way to study the magnetic shielding capabilities of a sheet, which is crucial in solving problems related to cavity resonance. As illustrated in Figure 8., this method is commonly used in such applications.
A means of mitigating these issues is to place a magnetic shielding sheet within the enclosure to attenuate or suppress the cavity resonance and eliminate internal reflections. To assess the effectiveness of this magnetic shielding sheet in a specific application, an experimental measurement system utilizing a coaxial line is employed. In this procedure, one terminal of the coaxial line is connected to a metallic surface, and the reflected energy within is measured using a network analyzer, as illustrated in Figure 9.
To characterize the absorption capability of various compositions and thicknesses, we repeated the process by attaching different magnetic shielding sheets over the reflective material. In this experiment, we evaluated the absorber materials by measuring and recording the reflection parameter S11. The measurement without a magnetic shielding sheet in the coaxial line served as a reference. By comparing the reference and measured data, we can assess the performance of each sheet.
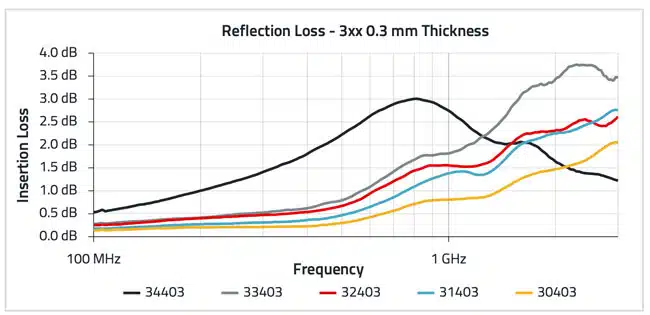
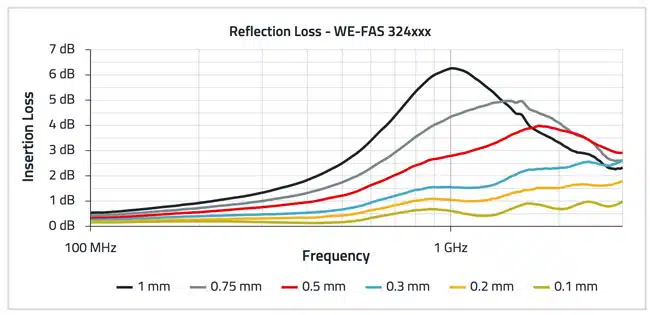
The reflection attenuation measured using the experimental coaxial line method is presented in Figures 10. and 11. Initially, we tested several WE-FAS with the same size and thickness (0.3 mm) but varying amounts of ferrite powder. Subsequently, WE-FAS 324 family members were also included, each with its respective thickness, to evaluate the attenuation capability in each scenario.
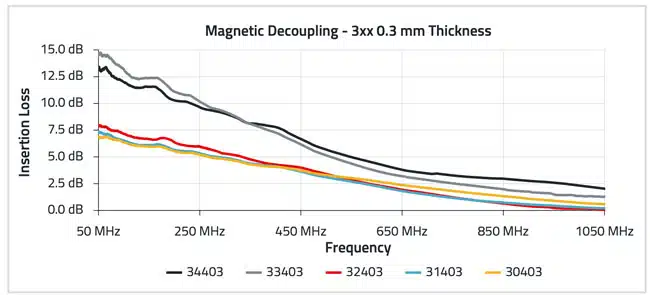
Magnetic Decoupling
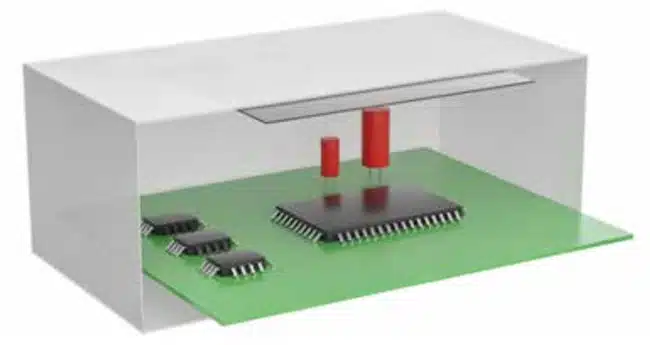
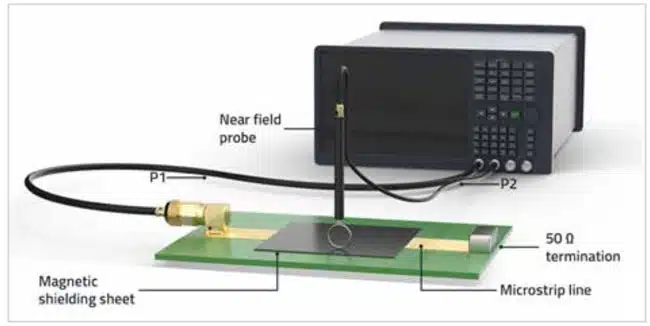
This technique analyzes the magnetic sheets’ absorption capability to reduce or suppress magnetic coupling. The absorption capability is measured using a near-field probe (NFP) on a microstrip line test fixture that generates electromagnetic interference (EMI). The absorption effect is determined by connecting one port of the network analyzer to one terminal of the microstrip line and shorting the other terminal with a 50 Ω load. Subsequently, the NFP is positioned perpendicular to the track and connected to the second port of the network analyzer, as shown in Figure 12. Finally, the network analyzer is configured as a signal source and signal receiver, and the S21 parameter is compared before (reference) and after placing each magnetic shielding sheet on the microstrip line. For this, the reference value is subtracted from the measurement data obtained with the placed absorber sample.
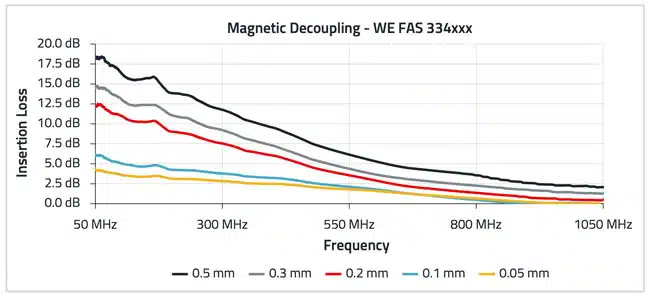
Data obtained through the magnetic decoupling technique is presented in Figures 13. and 14. Figure 13. depicts measurements of several WE-FAS samples with identical dimensions (0.3 mm) and thicknesses, yet varying compositions. Figure 14. illustrates the data collected by measuring the absorption capability of different sheet thicknesses of WE-FAS 334 family.