


Lorandt explains what the saturation current of a power inductor is, and also how the saturation current is measured at Würth Elektronik eiSos.
This article explains what inductor saturation current is, how it is defined and measured, and how to use it correctly in practical converter design. For this Lorandt uses a magnetics analyzer to measure the inductance value at several DC currents, and creates the saturation current chart out of them.
Key Takeaways
- Inductor saturation current is a critical parameter affecting efficiency and ripple in DC-DC converters.
- Manufacturers define saturation current as the DC current at which inductance drops by a specified percentage from its zero-bias value, usually 10%, 20%, or 30%.
- Saturation current can be measured using an LCR meter under DC bias and helps in determining the performance limits of inductors.
- Designers should choose inductors with saturation current at least 20-50% above expected peak to ensure reliability during load transients.
- Understanding inductor saturation current is essential for proper power supply design and enhancing converter performance.
Introduction
Inductors are key energy-storage elements in modern switching power supplies, where their magnetic cores must operate well below saturation to maintain stable inductance and predictable converter behavior. Saturation current is one of the most critical parameters for power inductors, directly influencing efficiency, output ripple, and the safe operating area of DC-DC converters.
Fundamentals of Inductance and Saturation
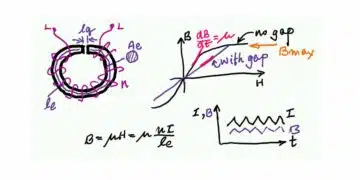
An inductor stores energy in the magnetic field created by current flowing through its winding, with inductance L0 relating voltage and current via = L0 ⋅ di(t)dt). In real components, the inductance is not perfectly constant: as magnetic flux in the core approaches the material’s limits, the permeability drops and the inductance falls, indicating the onset of saturation.
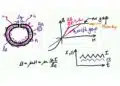
Magnetic Core Behavior
Magnetic materials exhibit a nonlinear relationship between magnetic field strength H and magnetic flux density B, described by a hysteresis curve that flattens as the material saturates. In the linear region, small changes in current cause proportional changes in flux, while near saturation, large current changes produce only small additional flux, effectively reducing inductance.
Core Material Influence on Saturation Characteristics
The saturation behavior of an inductor varies significantly depending on the magnetic core material used in its construction. Ferrite cores, powder iron cores, and composite powder cores each exhibit distinct saturation characteristics that influence their suitability for different applications.
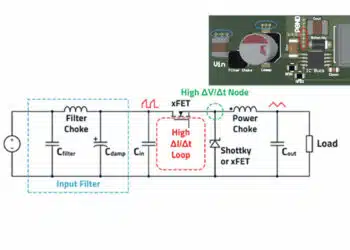
Effective Inductance in Power Applications
In power converters, the effective inductance under DC bias determines current ripple and energy storage capability rather than the small-signal inductance at zero bias. As DC current increases toward the saturation region, the falling inductance increases ripple current and may push the converter outside its intended operating mode.
Ferrite Cores are made from ceramic compounds of iron oxide combined with nickel, zinc, or manganese. They provide high permeability and low core losses at high frequencies but exhibit sharp, hard saturation. Once the flux density reaches the saturation point, the permeability drops rapidly and the inductance collapses abruptly. This makes ferrite cores ideal for applications where operation must stay well within the linear region.
Powder Iron and Composite Cores consist of magnetically permeable particles coated with an insulating binder and compressed into shape. These materials display gradual, soft saturation—the inductance decreases progressively as current increases rather than collapsing suddenly. Soft saturation allows controlled operation slightly beyond the nominal saturation current in transient conditions, providing a safety margin in high-current applications such as GaN-based converters and high-power DC-DC regulators.
Material Selection Guidelines: Choose ferrite cores for low-current, high-frequency applications (>1 MHz) where sharp inductance definition is acceptable. Select powder cores for high-current, moderate-frequency applications (100 kHz – 1 MHz) where gradual saturation provides better transient handling and thermal stability.
Comparison of Core Materials
The following table compares key saturation-related parameters across common inductor core materials:
| Core Material | Saturation Flux Density (Bsat) | Saturation Type | Frequency Range | Temperature Stability | Typical Applications |
|---|---|---|---|---|---|
| Ferrite (MnZn, NiZn) | 300-500 mT | Sharp (hard) | 100 kHz – 10 MHz | Moderate | High-frequency SMPS, RF |
| Powder Iron | 1000-1500 mT | Gradual (soft) | DC – 500 kHz | Good | Power inductors, filters |
| Sendust / Composite | 800-1200 mT | Gradual (soft) | 50 kHz – 1 MHz | Very Good | High-current DC-DC |
| Nanocrystalline | 1200-1500 mT | Gradual (soft) | DC – 100 kHz | Good | Low-noise power |
Definition of Saturation Current
Manufacturers commonly define saturation current as the DC current at which the inductance drops by a specified percentage from its initial zero-bias value, often 10%, 20%, or 30% depending on the catalog convention. This definition links a purely magnetic limit to a measurable change in inductance, making it practical for both characterization and design.
Percentage Drop Criteria
If the initial inductance at zero DC bias is L0, then a saturation current criterion of 10% drop corresponds to a current Isat,10% at which the measured inductance L(I) equals 0.9 x L0. Some vendors specify several saturation current levels, such as 10% and 30% inductance drop, to provide more information about the knee of the inductance-versus-current curve.
Measurement of Saturation Current
Saturation current is measured using an LCR meter or impedance analyzer with superimposed DC bias current, typically at a low AC frequency like 1 kHz and small AC amplitude (e.g., 250 mV) to approximate small-signal conditions. The setup involves sweeping the DC bias from 0 to a maximum expected current (e.g., 800 mA), recording inductance at discrete steps, and plotting the inductance versus DC current to identify the drop point.
Typical Measurement Setup
The measurement uses a Wayne Kerr LCR instrument with a DC bias load connected via prepared leads, ensuring the inductor is properly mounted for accurate readings. Conditions include room ambient temperature, as thermal effects are separate from saturation characterization.
Inductance vs. Current Graph Analysis
The resulting graph shows a linear region up to about 300 mA where inductance remains stable, followed by a gradual drop marking the saturation onset. This knee indicates the limit for linear operation in DC-DC converters.
| DC Bias Current (mA) | Inductance (μH) | Percentage Drop (%) |
|---|---|---|
| 0 | 10.0 | 0 |
| 100 | 10.0 | 0 |
| 300 | 9.95 | 0.5 |
| 500 | 9.0 | 10 |
| 800 | 7.0 | 30 |
Industry Standards for Saturation Current Testing
Saturation current measurements follow industry-standard test protocols to ensure consistency across manufacturers. Key relevant standards include:
IEC 62024-2 (High-frequency inductors for telecommunication equipment) specifies performance rating methods including DC bias characteristics and saturation current determination. The standard defines test conditions for small-signal inductance measurement under DC bias, typically using 1 kHz AC excitation at low amplitude (100-250 mV) to simulate incremental permeability.
IEC 61007 (Transformers and inductors for use in electronic and telecommunication equipment) describes general test methods including DC bias testing, core loss measurement, and thermal rating procedures. This standard provides the foundation for saturation characterization across different inductor types.
Most manufacturers follow these IEC guidelines, defining saturation current at 10%, 20%, or 30% inductance drop from the zero-bias value. Understanding these standards helps engineers compare datasheets from different vendors and interpret saturation current specifications correctly.
Temperature Dependence of Saturation Current
While saturation current measurements are performed at room temperature (typically 25°C), the actual saturation behavior varies with operating temperature depending on core material properties. This temperature dependence must be considered in thermal design.
Ferrite Materials exhibit increased saturation flux density (Bsat) at elevated temperatures—the Curie temperature effect causes the saturation point to shift higher as temperature rises. However, initial permeability decreases with temperature, resulting in lower inductance even before saturation. The net effect is that ferrite inductors may handle higher peak currents at elevated temperatures but with reduced overall inductance.
Powder Core Materials show more stable saturation characteristics across temperature, with only moderate changes in both permeability and saturation flux density. This makes powder cores preferable for designs operating over wide temperature ranges.
Design Practice: For applications with significant self-heating or ambient temperature variation (automotive, industrial), verify saturation current at the maximum expected operating temperature. Derating factors of 10-20% may be required for ferrite-core inductors operating above 85°C. For detailed analysis of temperature effects on saturation current, refer to our dedicated article on temperature influence of inductor saturation current.
Saturation Current vs. Rated Current
Saturation current characterizes the magnetic limit and is independent of temperature, while rated current is the maximum allowable RMS current based on thermal rise, typically lower than saturation current to prevent overheating. Designers must ensure the inductor’s saturation current exceeds the peak current in the converter to avoid nonlinear operation.
Key Differences
Saturation current focuses on inductance stability, whereas rated current ensures thermal management in continuous operation. For optimal design, select inductors where saturation current is at least 1.5 times the peak ripple current.
Parameter Comparison
| Parameter | Saturation Current | Rated Current (I<sub>rms</sub>) |
|---|---|---|
| Definition | DC current for specified inductance drop (10%, 20%, or 30%) | Maximum RMS current for specified temperature rise (typically 40°C) |
| Measurement Basis | Magnetic behavior (flux density limit) | Thermal limit (I²R losses and core heating) |
| Temperature Dependence | Material-dependent (ferrite: increases with T; powder: stable) | High (derates significantly with ambient temperature) |
| Design Use | Peak current limit in converter | Average/RMS current handling |
| Typical Margin | 1.2-1.5× peak current | 1.0-1.2× RMS current |
| Failure Mode | Inductance collapse, ripple increase, instability | Overheating, degradation, thermal runaway |
Design Implications for DC-DC Converters
In buck or boost converters, operating near saturation increases output voltage ripple and reduces efficiency due to higher peak currents and core losses. Proper selection requires calculating peak inductor current as Ipeak = Iout + ΔI2, ensuring Isat > Ipeak.
Practical Selection Guidelines
Choose inductors with saturation current 20-50% above expected peak for margin against load transients. Simulate or measure under actual bias conditions for validation.
Application-Specific Considerations
Different converter topologies and switching technologies impose distinct requirements on inductor saturation margins:
Silicon-based Buck/Boost Converters (100-500 kHz switching) typically use ferrite-core inductors with 30-50% saturation margin above peak current. The sharp saturation characteristic provides clear operating boundaries and predictable behavior.
GaN and SiC High-Frequency Converters (1-10 MHz switching) require careful saturation management due to faster current slew rates. Composite powder cores with soft saturation are often preferred, allowing transient current excursions beyond nominal saturation without catastrophic inductance collapse. Design margin should be 20-30% for soft-saturation materials.
Automotive and Industrial Applications with wide temperature ranges (-40°C to +125°C) must account for temperature-dependent saturation shifts. Use powder cores for thermal stability or derate ferrite-core saturation current by 15-20% when operating above 85°C continuously.
Load Transient Response requirements may dictate higher saturation margins. For converters with sudden load steps exceeding 50% of full load, maintain saturation current at least 2× the nominal peak to accommodate inrush without entering the nonlinear region.
Related Articles
For deeper understanding of inductor behavior and applications in power electronics, explore these related technical articles:
- Temperature Influence of Inductor Saturation Current
- Detailed analysis of how operating temperature affects the saturation current behavior of different core materials, with practical derating guidelines for high-temperature applications.
- Storage Chokes and Power Inductors
- Comprehensive guide to power inductor types, construction, and selection criteria for energy storage applications in switching regulators and DC-DC converters.
- Inductors: Inductance, Impedance, and Losses
- Fundamental principles of inductor behavior including AC impedance, frequency response, quality factor, and loss mechanisms in magnetic components.
- Würth Elektronik eiSos
- Premium supplier profile featuring power magnetics, inductors, transformers, and comprehensive technical support for power electronics design.
Conclusion
Understanding and properly applying saturation current specifications is essential for reliable power supply designs, preventing failures from unexpected inductance variations. Core material selection—whether ferrite for high-frequency precision or powder cores for high-current robustness—plays a crucial role in optimizing saturation behavior for specific converter topologies.
By selecting inductors with adequate saturation margins and distinguishing them from thermal-rated currents, engineers can achieve efficient and stable DC-DC converter performance. Future advancements in core materials may extend linear ranges, but core principles remain critical for current applications.
FAQ about Saturation Current of an Inductor
Saturation current is the DC current at which the inductance of a power inductor starts to drop significantly because the magnetic core approaches its flux density limit, causing the material permeability to decrease and the inductance to fall from its initial value.
In practice, saturation current is usually defined as the DC current at which the inductance has dropped by a fixed percentage, often around 10%, from the initial inductance measured at zero DC bias.
The saturation current is measured using an LCR meter or magnetics analyzer with a superimposed DC bias, sweeping the DC current from zero up to the target value while recording inductance at each step and then reading the current at the specified inductance drop point.
Typical conditions include a small-signal AC test at about 1 kHz and around 250 mV AC level, with DC bias swept from 0 up to several hundred milliamps, performed at room ambient temperature.
The inductance versus DC bias current graph usually shows a flat, almost constant inductance region at low current, followed by a bend where the inductance starts to decrease as current approaches the saturation range of the core material.
In a DC-DC converter, the inductor sees a peak current that includes the ripple component, so the saturation current must be higher than the maximum ripple peak current to keep operation linear and to ensure the inductor can store the required energy without collapsing its inductance.
If an inductor is driven above its saturation current, the inductance drops, current rises faster than expected, output ripple increases, and the converter can become unstable or overstressed, potentially damaging components.
Saturation current is defined by the magnetic behavior of the core and an inductance drop criterion, while rated current is determined by thermal limits and specifies the maximum current that the inductor can carry continuously without exceeding a given temperature rise.
Ferrite cores exhibit sharp saturation with rapid inductance drop, while powder iron and composite cores show gradual soft saturation that allows controlled operation during transients. Ferrite is preferred for high-frequency, low-current applications, whereas powder cores suit high-current designs with wide operating margins.
Yes, though differently by material. Ferrite cores show increased saturation flux density at higher temperatures (approaching Curie point) but reduced permeability. Powder cores exhibit better thermal stability. Operating temperature significantly affects saturation behavior and should be considered in thermal designs. For details, see our article on temperature influence of inductor saturation current.
Key standards include IEC 62024-2 for high-frequency inductors and IEC 61007 for transformers and inductors. These specify test conditions (typically 1 kHz, 100-250 mV AC with DC bias sweep) and define saturation current as the point of specified inductance drop (10%, 20%, or 30%).
For high-frequency GaN/SiC converters (1-10 MHz), use 20-30% margin above peak current with soft-saturation powder cores preferred over hard-saturation ferrite. The faster switching and higher current slew rates require materials that tolerate transient excursions beyond nominal ratings.
How to Measure Saturation Current of an Inductor
- Step 1: Prepare the test setup
Connect the inductor to the LCR meter or magnetics analyzer using a suitable fixture or short leads, ensuring good contact and minimal parasitic effects, then connect the DC bias module in series according to the instrument manual.
- Step 2: Configure measurement conditions
Set the AC test frequency to around 1 kHz and select a small AC level of approximately 250 mV so that the instrument measures the small-signal inductance at each DC bias point.
- Step 3: Define the DC bias sweep
Program the DC bias current sweep to start from 0 A and increase up to the maximum expected operating current, for example up to about 800 mA, using reasonable current steps that allow a smooth inductance versus current curve.
- Step 4: Run the measurement sweep
Start the sweep so that the instrument applies each DC current level, measures inductance at that point, and records the data; the sweep typically advances automatically in fixed time steps until it reaches the programmed maximum current.
- Step 5: Generate the inductance vs. current graph
After the sweep finishes, use the instrument’s software to generate an inductance versus DC bias current graph, which shows how inductance stays nearly constant at low current and then begins to drop as saturation effects appear.
- Step 6: Measure the saturation current
From the graph or the measurement table, locate the current where inductance has decreased by the specified percentage, such as 10% lower than the initial zero-bias value, and record this current as the saturation current of the inductor.
- Step 7: Compare with converter ripple current
Compare the measured saturation current with the maximum ripple peak current expected in the target DC-DC converter and ensure that the saturation current is clearly higher to maintain linear inductance and reliable operation.