In its latest survey of ECIA members across the electronics component supply chain, ECIA found renewed optimism for industry sales in June compared to May 2020.
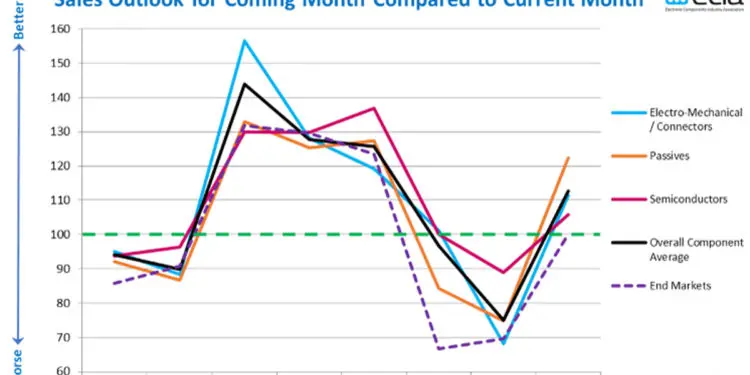
Based on a detailed monthly survey, ECIA has developed a top-level index showing relative estimates for electronic component sales in the current month compared to the prior month and expectations for the coming month compared to the coming month.
In the most recent survey, the sentiment index jumped from a low of 75 in the April survey looking toward May up to nearly 113 for the month of June compared to May. Improved sales expectations were reported for every major component category – Electro-Mechanical/Connectors, Passives and Semiconductors. In addition, the overall average outlook for sales by major end markets recovered back to a “stable” level of 100 in the index. As expected, the strongest end market sales expectations are focused on medical equipment, Telecom Networks and Avionics/Military/Space. However, even markets facing a more challenging environment are expected to improve in June.
Dale Ford, ECIA Chief Analyst, observed that the industry entered the year full of robust expectations following an exceedingly difficult market in 2019. Unfortunately, the spread of the COVID-19 pandemic can be seen in the complete collapse of industry sentiment in March and April. The gradual reopening of the economy has prompted greater optimism for June. However, it should be noted that this is compared to a very painful month of May. In addition, Ford cautioned, “This survey was completed before the impact of the recent riots on businesses across the U.S. was felt. Retail sales will likely be harmed in the near term by the current social upheaval and it is too soon to assess how far this damage will spread. At a minimum it will likely delay some of the renewed economic activity we have started to see.”
ECIA members can view detailed results of these monthly surveys in the “North America Electronic Component Sales Trends (ECST) report. This report presents data in 43 figures and 172 tables covering current sales expectations, sales outlook, product cancellations and product lead times. The data is presented at a detailed level for six major electronic component categories and eight end markets. Also, survey results are segmented by aggregated responses from manufacturers, distributors and manufacturer representatives.


