


This article written by Dennis Zogbi, Paumanok Inc. published by TTI Market Eye provides an overview of costs to produce active and passive electronic components.
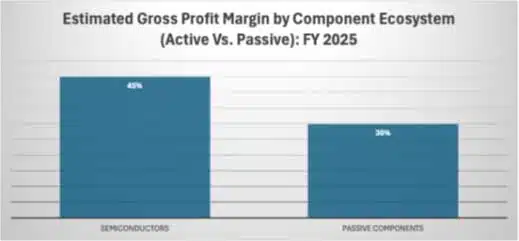
In the global electronic component industry, gross profitability varies between 30% and 45% (refer to Table 1.0) depending on whether the component is passive or active in design.
Conversely, production costs for electronic components range from 55% to 70% of revenues. Both ecosystems are measured using the same financial metrics based on fixed and variable cost structures.
This article delves into the components that contribute to the cost of sales for each supply chain and aims to explain the disparity in value and volume of consumption between the two. Additionally, it examines the industry’s trajectory as it strives for improved, smaller, and faster components.
For this analysis, average gross profit margins are derived from a comprehensive review of the financial reporting of the top 10 semiconductor manufacturers and the top 13 passive component manufacturers.
In 2025, certain vendors in the GPU and multilayered ceramic chip capacitors (MLCCs) sectors have demonstrated higher profitability compared to their peers, which has slightly skewed the data reporting for the fiscal year ending March 31, 2025. This trend is projected based on nine months of reported data. Furthermore, primary studies conducted in 2005 and 2013 revealed that post-pandemic hyper-inflation has also had an impact on profitability and component EBITDA.
Active Versus Passive Components
The semiconductor industry boasts higher gross profit margins compared to its support components due to the unique requirements associated with research and development, which necessitates substantial capital equipment costs, particularly advanced lithography equipment. Consequently, equipment manufacturers in this sector achieve an average gross profit margin of 53%, making them the industry’s highest-grossing entities.
The Semiconductor Component Ecosystem
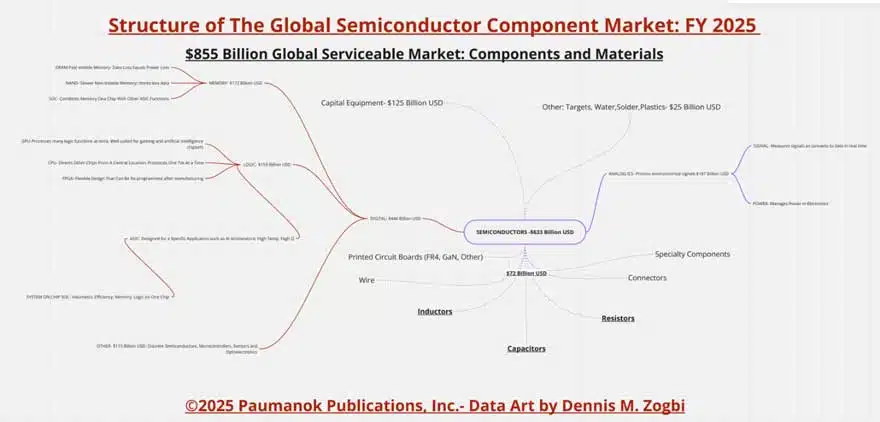
We estimate the global active component semiconductor industry to be worth $633 billion in 2025 (refer to Figure 2.0). The average gross profitability stands at 45% ($285 billion). However, as we’ve mentioned, the semiconductor industry heavily relies on third-party equipment vendors for technological advancements, leading to substantial R&D spending on unique capital equipment costs, amounting to $125 billion in 2025.
Semiconductors: Unraveling the Complex Ecosystem
An active component is a semiconductor device categorized into two primary ecosystems: digital and analog. Digital semiconductors encompass memory and logic, while analog semiconductors encompass both signal and power.
Digital memory semiconductors include DRAM (volatile memory) and NAND (non-volatile memory). Digital logic semiconductors include the GPU (graphics processing unit), CPU (central processing unit), FPGA (field-programmable gate array), and ASIC (application-specific integrated circuit).
The GPU excels at processing multiple tasks simultaneously, making it ideal for graphics cards and artificial intelligence chipsets (where global financial attention has been focused in 2025). In contrast, the CPU processes only one task at a time and serves as a central hub, directing instructions to other chip sets.
The FPGA stands out as a separate logic semiconductor business due to its reprogrammable components after manufacturing (a double-edged sword). On the other hand, the ASIC is designed for a specific purpose and provides passive support components based on high temperature, high frequency, or high voltage. It has also been extended to include AI accelerators, particularly in applications like renewable energy and electric transport propulsion circuits, which have gained traction over the past five years.
The industry’s technical trajectory has remained consistent for the past seven decades: continuous improvement in terms of better, smaller, and faster semiconductors.
Analog semiconductors, a crucial component of the semiconductor ecosystem, encompass signal processors that measure real-world signals like temperature, sound, and light, as well as power semiconductors used in industrial and professional electronics for power management and efficiency. To further the trajectory of semiconductors, the current trend in packaging is towards a system-on-chip (SOC), which merges the best functions of multiple chips onto a single ultra-small chipset.
SAM Estimated at $855 Billion for 2025
The serviceable available market (SAM) for active and passive components, related equipment, and materials is projected to be worth $855 billion in 2025, including $633 billion in active component sales, $72 billion in passive component and “other” materials sales, and $125 billion in capital equipment sales (as depicted in Table 2.0).
In January 2025, export restrictions are focused on capital equipment, particularly lithography equipment and GPUs, with the intention of limiting selected countries’ compute power to a maximum of 790 million TPP through 2027, which is equivalent to 50,000 advanced AI chips.
The Passive Component and Material Support Ecosystem
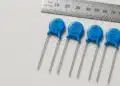
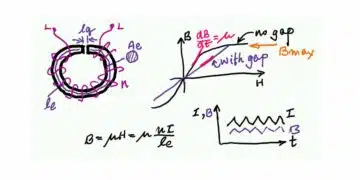
Passive electronic components play a vital role in supporting all semiconductors by providing capacitance, resistance, and inductance as required for the active circuitry to function effectively. Capacitance and resistance are fundamental and widely used, while inductance (in nanohenries) is more application-specific and tailored to specific designs.
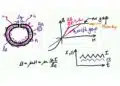
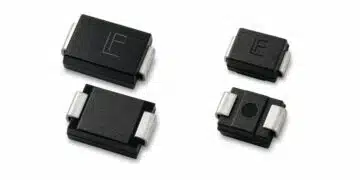
Capacitors provide capacitance, which is essential for bypass, decoupling, filtering, and commutation in circuit applications. However, in specific circumstances, capacitors may be the primary component in a black box operation, particularly in pulse discharge circuitry for medical and defense applications. Resistance encompasses the application of ohmic values to circuitry, including linear resistance, sensing, switching, and circuit protection for non-linear resistors. Inductance, a magnetic function, provides nano-henries to the circuit for noise abatement, signal and power, or fine-tuning applications in application-specific circuitry.
Passive components have the lowest profitability among all support materials, and we estimate their industry-wide share to be 30% in 2025.
Other materials that contribute to the active component market include sputtering targets, printed circuit boards, wire and cable, connectors, gasketing, solder, lead-frames, and plastics packaging and molding materials.
These materials collaborate to form a complex ecosystem that must function harmoniously for a successful outcome.
Value and Volume Equations: Bill of Materials
The Bill of Materials (BOM) Value Equation:
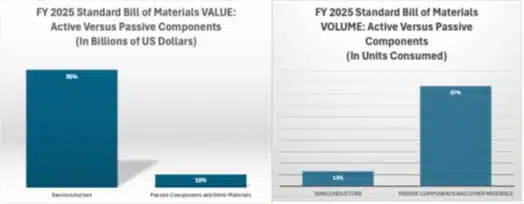
For 2025, we anticipate that 90% of the global BOM for electronic devices ($633 billion) will be allocated to active components (semiconductors), while 10% will be spent on passive component support components and related raw materials.
The Bill of Materials Volume Equation:
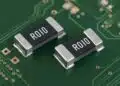
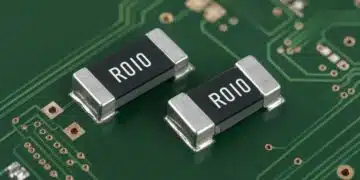
In contrast, regarding volume consumption, the situation is reversed. The number of units consumed favors passive components, accounting for 87% of the total. This preference is primarily driven by the consumption of MLCCs, thick film chip resistors, and ferrite beads.
Active and Passive Components: Equipment and Materials Intensive
The reader should understand that active components are capital equipment-dependent, and their prices reflect this variable cost structure. In contrast, high-volume passive components are raw material-intensive and depend on a different set of variables, primarily anchored in metal and ceramic ores, powders, and pastes.
Trends Driving Component and Materials Value and Innovation
As mentioned in this article, the driving force behind the components industry over the past 70 years has been the pursuit of better, smaller, and faster components. Key products developed from this trend include portable computers, wireless handsets, and artificial intelligence.
Volumetric Efficiency
When considering consumption volumes, it’s evident that any printed circuit board typically comprises approximately 87% passive components and 13% active components. Therefore, volumetric efficiency is significantly influenced by passive components, with a particular emphasis on MLCCs (multilayer ceramic capacitors), thick film chip resistors, and ferrite beads.
Over the past 70 years, these three product lines have made remarkable strides in creating electronic components with increasingly smaller physical footprints while still providing essential capacitance, resistance, and inductance at voltage. Additionally, the semiconductor industry has also achieved volumetric efficiency through the development of SOC (system-on-chip) technology, which integrates memory, logic, and other functions onto a single chip. Furthermore, they are experimenting with advanced passive component solutions, such as silicon capacitors produced using ion implantation machines.
A Suite of Support Components
In addition to the workhorses like MLCCs, thick film chips, and ferrite beads, there are also electrolytic capacitors, including aluminum and tantalum, and the other electrostatic capacitors, the plastic film capacitor. Additionally, there are nichrome film resistors, wirewound resistors, tin oxide resistors, tantalum nitride resistors, and SMD chip coils and ferrite core parts. Each of these passive component categories showcases the diverse range of parts and materials found in any circuit board.
Other advanced materials used for the substrate and connections are primarily related to value-added plastics, ceramics, and metals. Printed circuit boards are made from FR4 plastics and wire, while connectors are manufactured from plastic insulation and jacketing materials, copper wires (ribbon cable and power cable), and numerous solder applications. These components are further enhanced with advanced substrates made from ceramics and metals for specific circuitry requiring high voltage, high frequency, and high temperature.
Third-party modularization involves combining passive electronic components to form fundamental board sub-assemblies, such as power supplies, filters, antennas, and application-specific modules like power amplifiers. The pursuit of improved performance, smaller size, and faster speed has led to the development of third-party ecosystems where individual brands excel at specific tasks within the vast global high-tech economy.
The current movement towards a SOC solution represents the pinnacle of computing capabilities. While traditional manufacturers of memory and ASICs are also pursuing new methods to achieve better, smaller, and faster performance, as evident in Figure 3.0 above, it is clear that the solution lies in reducing the size of passive components.
From the passive component perspective, the solution has always been to produce smaller units through the manipulation of advanced ceramic and metal powders and pastes, along with the ability to stack multiple layers of ceramics while producing trillions of pieces industry-wide.
Moving forward, the future direction of volumetric efficiency for both active and passive components lies in integrating semiconductor solutions for both functions within a single system-on-chip.
It’s crucial to recognize that no single component of the ecosystem exists independently. Each set of sub-assemblies must converge at the end of their production cycle to form a black box that provides consumers with both provenance and utility of design. Large-end boxes encompass automobiles, computers, TV sets, and home theater electronics, while small-end boxes include power supplies, filters, engine control units, DC link circuits, thermostats, automation and drives, motor controllers, logging tools, civil aircraft, satellite electronics, and relays.
When it comes to costs, there’s a fundamental distinction between active and passive components. Semiconductors are capital equipment-intensive, while passive components are raw material-intensive. Variable costs associated with machine availability have a significant impact on the ecosystem’s ability to produce. For instance, the rise in exports over the past five years of photolithography and masking equipment from Scandinavia and Japan is a testament to this trend.
On the positive side, the semiconductor manufacturing equipment itself is designed to be volumetrically efficient, eliminating the need for large footprint factories. In fact, there’s so much wafer fabrication capacity dedicated to each tier of product output that there’s ample opportunity for private labeling and fabless model production.
Raw materials for semiconductors are a secondary variable cost that form a unique ecosystem involving “targets, stencils, and masks” and a specialized market for high-purity industrial water for cleaning them. There’s also a market for high-purity silicon glass wafers, another narrow ecosystem, despite being based on an abundant resource (silicon). However, as one ascends the technical scale of polishing, the market becomes more specialized.
These are all key feedstocks for semiconductor production, yet they rely on passive electronic components to function.
Semiconductors have low volumes compared to their passive support components and high average unit prices, making them the largest cost factor in the bill of materials of any high-tech, electronic end product. Passive electronic components and all other non-electronic component materials account for only 10% of the value of a BOM, while active components account for 90%.
Passive Electronic Components: Costs to Produce
For passive electronic components, which we’ve noted to have an average gross profit margin of 30% and a cost of goods sold of 70%, vendors primarily focus on variable costs, including raw materials, labor, variable overhead, and variable manufacturing costs.
Raw materials costs represent the largest single cost factor in the production of capacitors, regardless of dielectric. Therefore, many historical methods for cost savings and increased profitability have focused on managing and manipulating the costs associated with buying and processing raw materials, including feedstocks, engineered dielectrics, cathode materials, additives, electrodes, terminations, and leads.
Summary and Conclusions:
In summary, raw materials for semiconductors form a unique ecosystem involving “targets, stencils, and masks” and a specialized market for high-purity industrial water for cleaning them. There’s also a market for high-purity silicon glass wafers, another narrow ecosystem, despite being based on an abundant resource (silicon). However, as one ascends the technical scale of polishing, the market becomes more specialized.
Semiconductors have low volumes compared to their passive support components and high average unit prices, making them the largest cost factor in the bill of materials of any high-tech, electronic end product. Passive electronic components and all other non-electronic component materials account for only 10% of the value of a BOM, while active components account for 90%.
For passive electronic components, which we’ve noted to have an average gross profit margin of 30% and a cost of goods sold of 70%, vendors primarily focus on variable costs, including raw materials, labor, variable overhead, and variable manufacturing costs.
Raw materials costs represent the largest single cost factor in the production of capacitors, regardless of dielectric. Therefore, many historical methods for cost savings and increased profitability have focused on managing and manipulating the costs associated with buying and processing raw materials, including feedstocks, engineered dielectrics, cathode materials, additives, electrodes, terminations, and leads.
We value the global component and support equipment and materials industries, which are projected to reach a total of $855 billion by 2025. Semiconductors alone will contribute $633 billion, followed by semiconductor manufacturing equipment valued at $125 billion (which is an extension of R&D). Additionally, all related support passive components and electronic materials are expected to generate $72 billion in revenue by 2025.
In terms of gross profit margins, active components are projected to average 45% for 2025, while passive components will have an average gross profit margin of 30%. Semiconductor manufacturing equipment stands out as a unique industry outgrowth, valued at $125 billion and should be regarded as an extension of R&D.
Over the past 70 years, the electronic component manufacturing industry has undergone a remarkable transformation, characterized by a trend towards smaller, faster, and more efficient production. We anticipate that this trend will persist and evolve further, driven by the increasing merger of high-volume, low-cost passives with high-value, low-volume SOC semiconductor components.