Passive Components Blog
No Result
View All Result
  • Home
  • NewsFilter
    • All
    • Aerospace & Defence
    • Antenna
    • Applications
    • Automotive
    • Capacitors
    • Circuit Protection Devices
    • electro-mechanical news
    • Filters
    • Fuses
    • Inductors
    • Industrial
    • Integrated Passives
    • inter-connect news
    • Market & Supply Chain
    • Market Insights
    • Medical
    • Modelling and Simulation
    • New Materials & Supply
    • New Technologies
    • Non-linear Passives
    • Oscillators
    • Passive Sensors News
    • Resistors
    • RF & Microwave
    • Telecommunication
    • Weekly Digest

    How a Digital Structural Twin Can Predict Tantalum Capacitor Reliability

    SCHURTER Buys Biaodi to Boost High-Voltage Protection Portfolio

    Binder Hybrid Connector Simplifies One Cable Automation

    Tapped Inductor Buck Converter Fundamentals

    TAIYO YUDEN Releases Mini Metal Power Inductors

    Molecular Memristor Shows Record 145 kH Emergent Inductance

    Planar vs Conventional Transformer: When it Make Sense

    Researchers Propose Next‑Gen Compact Memory Using Ultra-thin Ferroelectric Capacitors

    Nichicon ADN Automotive Hybrid Aluminum Capacitors Now Available in EMEA

    Trending Tags

    • Ripple Current
    • RF
    • Leakage Current
    • Tantalum vs Ceramic
    • Snubber
    • Low ESR
    • Feedthrough
    • Derating
    • Dielectric Constant
    • New Products
    • Market Reports
  • VideoFilter
    • All
    • Antenna videos
    • Capacitor videos
    • Circuit Protection Video
    • Filter videos
    • Fuse videos
    • Inductor videos
    • Inter-Connect Video
    • Non-linear passives videos
    • Oscillator videos
    • Passive sensors videos
    • Resistor videos

    Tapped Inductor Buck Converter Fundamentals

    Planar vs Conventional Transformer: When it Make Sense

    Modeling Fringing Field Losses in Inductors & Transformers

    Why Power Inductors Use a Ferrite Core With an Air Gap

    Transformer-Based Power-Line Harvester Magnetic Design

    Thermal Modeling of Magnetics

    Standard vs Planar LLC transformers Comparison for Battery Chargers

    How Modern Tools Model Magnetic Components for Power Electronics

    Advanced Loss Modeling for Planar Magnetics in the Frenetic Planar Tool

    Trending Tags

    • Capacitors explained
    • Inductors explained
    • Resistors explained
    • Filters explained
    • Application Video Guidelines
    • EMC
    • New Products
    • Ripple Current
    • Simulation
    • Tantalum vs Ceramic
  • Knowledge Blog
  • DossiersNew
  • Suppliers
    • Who is Who
  • PCNS
    • PCNS 2025
    • PCNS 2023
    • PCNS 2021
    • PCNS 2019
    • PCNS 2017
  • Events
No Result
View All Result
Passive Components Blog
No Result
View All Result

How a Digital Structural Twin Can Predict Tantalum Capacitor Reliability

14.5.2026
Reading Time: 10 mins read
A A

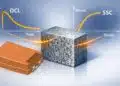
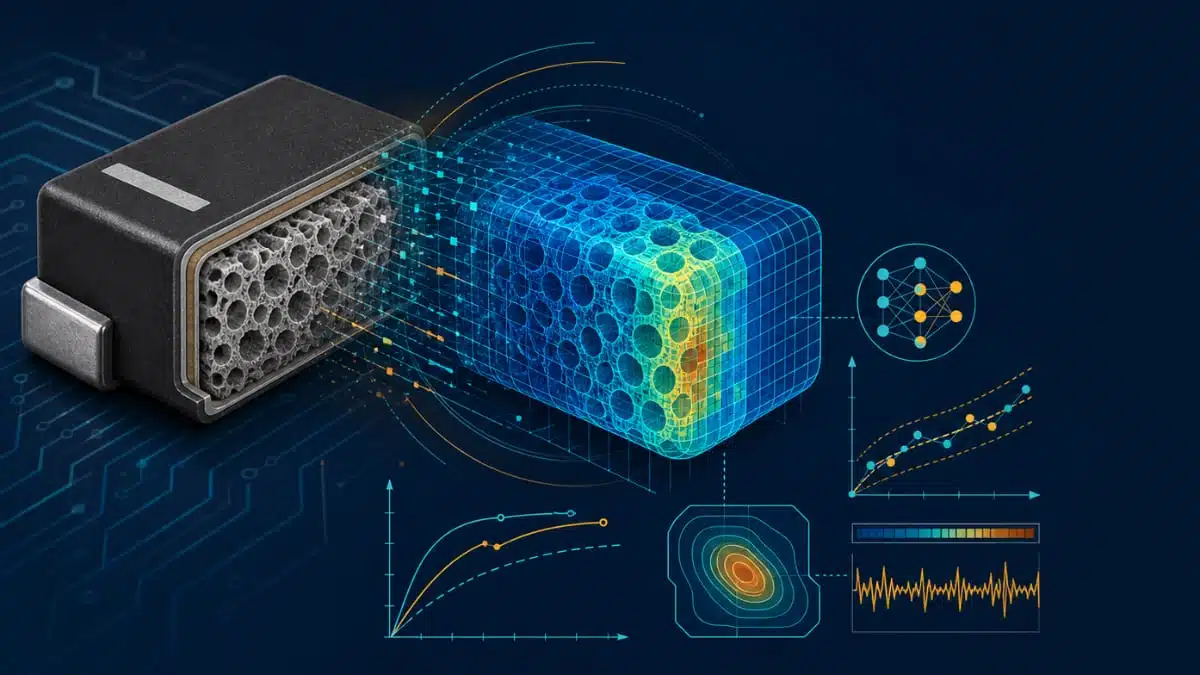
This article written by Vladimir Azbel, Ph.D., a semiconductor process reliability engineer consultant, shows how a simple mechanical test — the stress–strain curve (SSC) of a sintered tantalum pellet — together with a deterministic AI-assisted procedure can be used to build a kind of “Digital Structural Twin” of the anode. That twin acts as a structural “x-ray” of the porous network long before formation or electrical qualification begins and it can be used as an effective tool to predict tantalum capacitor reliability.

When we qualify tantalum capacitors today, we almost always look at electrical parameters: leakage current, capacitance, ESR, breakdown voltage, surge tests, and so on. These numbers tell us whether the part passed or failed the test, but they do not necessarily tell us why it behaves that way — or what may happen later during long-term operation.

RelatedPosts

Energy Localization in Tantalum Anode Formation: A Structural Perspective

Miniaturization of Tantalum Capacitors: Structural Limit Under Constant Rating

When More Capacitance Hurts Reliability: The Role of the Metallic Skeleton in Tantalum Anodes

In reality, failures begin much deeper, at the level of the porous tantalum anode structure itself. If the network of sintered particles and interparticle necks is weak, irregular, or locally constricted, no amount of acceptable electrical data can fully eliminate the long-term structural risk.

Why Electrical Parameters Are Not Enough

In modern production, one of the key parameters used to qualify tantalum powders is specific capacitance (CV/g). Two powders with identical CV/g appear electrically equivalent:

  • same nominal surface area
  • same nominal capacitance per gram
  • same electrical target

However, the structure behind that capacitance may be very different.

For example:

  • interparticle necks may be thinner or thicker
  • conductive pathways may be more or less robust
  • local defects and stress concentrations may differ significantly

As a result, two anodes can have:

  • identical CV/g
  • identical pressing conditions
  • identical sintering recipes
  • similar nominal process parameters

…and still exhibit substantially different leakage current stability and long-term reliability.

This leads to an important conclusion:

  • CV/g and process parameters alone do not guarantee structural equivalence.
  • Electrical equivalence does not necessarily mean structural equivalence

To move further, we need a method that evaluates the structure directly, not only the electrical result.

The Stress–Strain Curve as a Structural Fingerprint

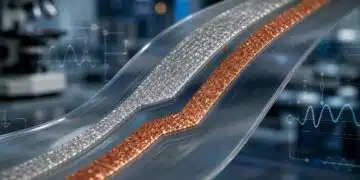
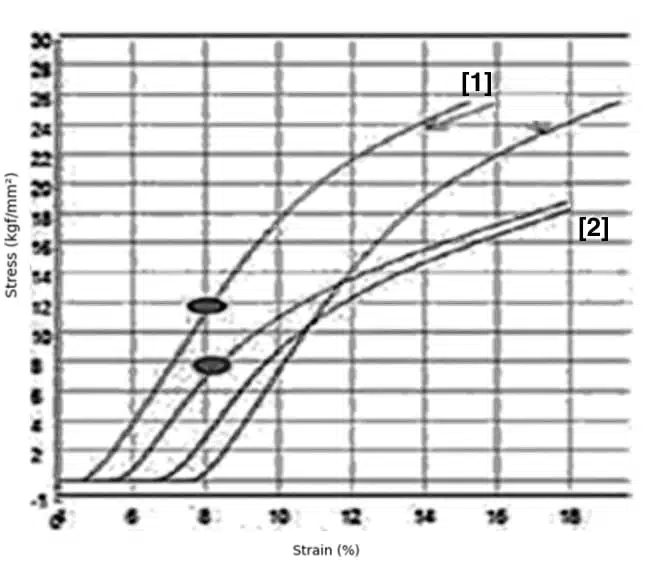
If a sintered tantalum pellet is compressed while measuring stress versus deformation, the resulting stress–strain curve becomes an extremely sensitive indicator of porous structure. For dense metals, stress–strain curves mainly reflect bulk material properties. See Figure 1.

For porous sintered materials, however, they reflect:

  • porosity
  • neck geometry
  • defect distribution
  • connectivity of the conductive framework
Figure 1 — Validation plot and AI-assisted extraction of E, Aᵧ, and K₂. The initial region defines E, the offset/intersection defines Aᵧ, and the post-yield slope defines K₂.

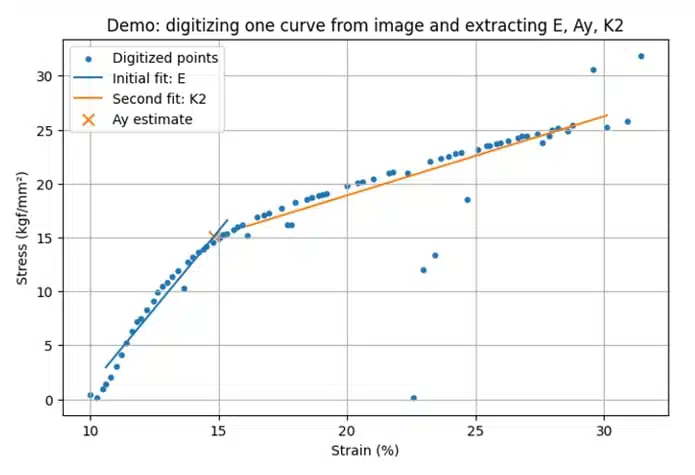
From the curve, three key parameters can be extracted:

  • E — initial stiffness, related mainly to porosity
  • Aᵧ — yield parameter associated with load-bearing neck geometry
  • K₂ — post-yield hardening parameter reflecting deformation behavior and defect participation

The stress–strain curve, therefore, becomes a mechanical signature of the porous network.

One may think of it as a kind of “CT scan” of the anode structure:

  • E reflects how dense or compliant the structure is
  • Aᵧ reflects the strength of current-carrying interparticle necks
  • K₂ reflects how the structure redistributes stress and how defects participate in deformation

The Physical Meaning of Aᵧ

Ay ∝ X²

where:

  • Aᵧ = yield-related structural parameter
  • X = effective interparticle neck size

This relationship is critically important because current in a tantalum anode flows through these necks. A moderate reduction in neck diameter, therefore, produces a much larger reduction in effective conductive cross-section.

This immediately affects:

  • local resistance
  • local heat generation
  • dielectric stress conditions

Thus, mechanical response becomes directly connected to electro-thermal reliability.

Where AI Actually Helps

When engineers hear the term “AI,” many imagine a black-box statistical system that predicts failures without physical understanding. That is not what happens here. The AI-assisted system performs three deterministic tasks:

  1. Digitization of stress–strain curves from PDF/image data
  2. Standardized extraction of E, Aᵧ, and K₂
  3. Matrix-based interpretation using predefined engineering rules

Importantly, the system does not invent the rules. The rules are predefined by engineering and physical principles.

For example:

  • Aᵧ is always determined using a standardized 0.2–0.3% offset method
  • K₂ is always determined in the post-yield region
  • preprocessing rules remain fixed for all samples

AI simply automates the repetitive and operator-dependent parts of the procedure.

This provides two major advantages: reproducibility and elimination of operator bias.

What the Analysis Looks Like

The analysis proceeds in several deterministic stages.

Step 1 — Tail Correction

Real SSC curves usually begin with a small “tail” caused by seating effects in the fixture. The system determines the initial strain offset ε₀ and redefines the true zero-strain point. This ensures that only the real structural response of the porous network is analyzed.

Step 2 — Determination of E

The initial linear region is fitted automatically. Its slope defines E:

  • lower E → higher porosity
  • higher E → denser and stiffer structure

Step 3 — Determination of Aᵧ

The elastic slope is shifted horizontally by a standardized offset. The intersection with the real SSC curve defines Aᵧ. This ensures consistent extraction across all samples.

Step 4 — Determination of K₂

The system evaluates the slope of the post-yield region.

K₂ reflects:

  • stress redistribution
  • defect participation
  • strain-hardening behavior

Once E, Aᵧ, and K₂ are extracted, the structure can be compared directly against:

  • qualified benchmarks
  • supplier references
  • incoming inspection limits
  • production batches

From Mechanical Parameters to Reliability Risk

The methodology becomes especially powerful when SSC parameters are interpreted together. For example:

• Aᵧ ↓ with K₂ ≈ constant
→ geometry-controlled limitation

• Aᵧ ≈ constant with K₂ ↑
→ defect-controlled behavior

• Aᵧ ↓ with K₂ ↑
→ combined geometry + defect risk

The matrices connect:

  • mechanical response
  • structural mechanism
  • electro-thermal behavior
  • reliability risk

The Core Reliability Chain

X ↓ → Rneck ↑ → I²R ↑ → Δ ↓ → Failure Risk ↑

where:
• X = neck size
• Rneck = local neck resistance
• Δ = thermal safety margin

A Real Example: Same CV/g, Different Structure

One of the most instructive examples is the comparison of powders with:

  • identical CV/g
  • identical pressing conditions
  • identical sintering recipe

Yet their SSC curves differ substantially – see Fig.2:

Figure 2 — SSC comparison of two powders with identical CV/g

The AI-assisted analysis shows:

  • Aᵧ of one sample is ~20–30% lower
  • K₂ remains approximately unchanged

This corresponds to a geometry-controlled structural difference. Physically, this means: the interparticle necks are thinner despite identical nominal capacitance.

From Parameter Control to Structural Control

The largest conceptual transition proposed here is: from parameter control to structural control.

Instead of asking only: “Did the capacitor pass the electrical test?”

The methodology asks:

“Does the structure possess sufficient electro-thermal stability for long-term operation?”

Conclusion

The stress–strain curve of a sintered tantalum pellet contains much more information than a conventional mechanical test would suggest. When analyzed using deterministic extraction rules and physics-based interpretation, it becomes a quantitative structural diagnostic tool.

The proposed methodology establishes a direct relationship:

structure → mechanical response → electro-thermal conditions → reliability

Artificial intelligence in this framework does not replace engineering understanding. It formalizes it. The result is a reproducible and physically grounded Digital Structural Twin capable of evaluating structural quality before electrical failure occurs.

Related

Recent Posts

Tapped Inductor Buck Converter Fundamentals

13.5.2026
16

Molecular Memristor Shows Record 145 kH Emergent Inductance

12.5.2026
17

Planar vs Conventional Transformer: When it Make Sense

11.5.2026
44

Researchers Propose Next‑Gen Compact Memory Using Ultra-thin Ferroelectric Capacitors

11.5.2026
29

Nichicon ADN Automotive Hybrid Aluminum Capacitors Now Available in EMEA

11.5.2026
25

Electrocaloric Multilayer Capacitors: Towards Quiet, Solid‑State Cooling Around Room Temperature

7.5.2026
187

KYOCERA 10 µF 0201 MLCC Brings High‑Capacitance into Mobile Designs

6.5.2026
56

Energy Localization in Tantalum Anode Formation: A Structural Perspective

4.5.2026
49

YAGEO Introduces C0G Flexible Termination Automotive MLCCs

30.4.2026
43

Upcoming Events

May 19
16:00 - 17:00 CEST

Designing Qi2 Wireless Power Systems: Practical Development and EMC Optimization

Jun 2
16:00 - 17:00 CEST

Calculation, Simulation and Measurement of 800V EMC Filters

Jun 16
16:00 - 17:00 CEST

EMC with EMC – EMC‑compliant design with electromechanical connectors

View Calendar

Popular Posts

  • Buck Converter Design and Calculation

    0 shares
    Share 0 Tweet 0
  • Boost Converter Design and Calculation

    0 shares
    Share 0 Tweet 0
  • Flyback Converter Design and Calculation

    0 shares
    Share 0 Tweet 0
  • LLC Resonant Converter Design and Calculation

    0 shares
    Share 0 Tweet 0
  • MLCC and Ceramic Capacitors

    0 shares
    Share 0 Tweet 0
  • Dual Active Bridge (DAB) Topology

    0 shares
    Share 0 Tweet 0
  • Capacitor Charging and Discharging

    0 shares
    Share 0 Tweet 0
  • What Electronics Engineer Needs to Know About Passive Low Pass Filters

    0 shares
    Share 0 Tweet 0
  • Ripple Current and its Effects on the Performance of Capacitors

    3 shares
    Share 3 Tweet 0
  • MLCC Case Sizes Standards Explained

    0 shares
    Share 0 Tweet 0

Newsletter Subscription


Passive Components Blog

© EPCI - Leading Passive Components Educational and Information Site

  • Home
  • Privacy Policy
  • EPCI Membership & Advertisement
  • About

No Result
View All Result
  • Home
  • Knowledge Blog
  • PCNS

© EPCI - Leading Passive Components Educational and Information Site

This website uses cookies. By continuing to use this website you are giving consent to cookies being used. Visit our Privacy and Cookie Policy.
Go to mobile version