


This work by Vladimir Azbel Ph.D. Semiconductor Process Reliability Engineer Consultant, presents an AI-assisted framework for structural diagnostics and physics-based reliability interpretation of sintered tantalum capacitor anodes based on stress–strain curve (SSC) parameters.
Yield strength (Ay) is used as a structural indicator of interparticle neck geometry and effective load-bearing cross-section. At the same time, the strain-hardening coefficient (K₂) reflects defect- and stress-related contributions associated with deformation heterogeneity.
A system of interpretation matrices is developed to enable AI-assisted mapping of SSC parameter deviations to physically grounded structural mechanisms. The matrix framework is further extended by linking each structural class to its electro-thermal behavior through an anode thermal model previously developed by the author [1].
This integration makes it possible to predict local overheating during formation and the risk of leakage current (DCL) instability already at the stage of the sintered pellet, following the physical pathway and thus predict the tantalum capacitor reliability:
structure → neck resistance → heat generation → thermal margin (Δ) → oxide-growth stability → reliability.
The proposed approach provides a physics-based tool for early-stage reliability assessment and shifts AI diagnostics from empirical correlation toward deterministic, physics-of-failure interpretation.
Introduction and Role of AI
SSC parameters are used as a tool for material control and structural monitoring. They serve as quantitative criteria when compared either with regulatory requirements (e.g., ASTM allowable limits) or with predefined benchmark values of SSC parameters (Ay, k₁ ≈ E, K₂).
Importantly, these benchmark values are not universal. They are established based on the analysis of sintered pellets produced from production powder lots intended for the qualification of tantalum capacitors of a specific design. Accordingly, a dedicated set of benchmark parameters must be defined for each powder type and capacitor design.
The proposed approach enables early structural control before anodization for current production lots of the same capacitor design. This allows detection of structural deviations before dielectric formation and ensures physically grounded interpretation of results within an AI-assisted diagnostic framework.
SSC parameters provide an integral mechanical representation of the porous structure and are defined on the stress–strain curve, as illustrated in Fig. 1.
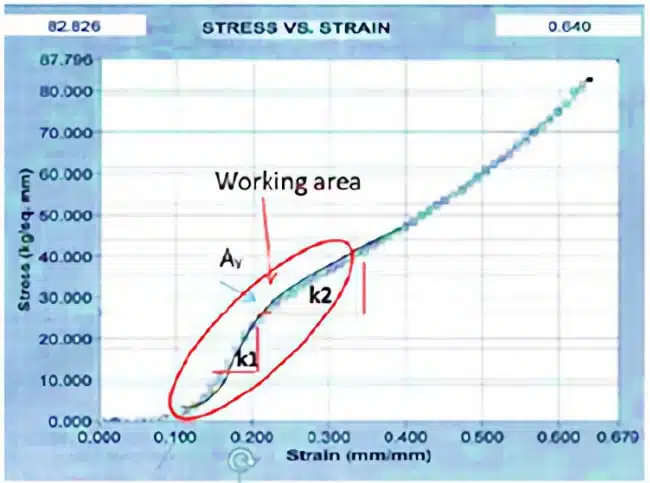
Fig. 1. Stress–strain curve of a sintered tantalum pellet illustrating the definition of SSC parameters (Ay, k1, K2) used for structural diagnostics. The highlighted region corresponds to the working deformation range.
It is important to note that SSC parameters are physically related to the structure of the sintered porous pellet, as described in established models. This enables identification of dominant structural factors when deviations from benchmark or allowable values are observed, and allows these deviations to be linked to probable causes within the technological process.
In this framework, the roles of the engineer and AI are clearly separated. The engineer defines the benchmark parameters and the system of interpretation matrices, while the AI performs automated comparison, deviation detection, matrix selection, and interpretation of SSC data.
The role of AI in the proposed approach is strictly defined as:
- automatic comparison of measured parameters with benchmark values and allowable limits;
- detection and ranking of deviations;
- interpretation of deviations based on predefined physical relationships;
- generation of a diagnostic conclusion.
The interpretation matrices are defined before data analysis and implemented in the AI as a physics-based rule system. Thus, the AI does not derive empirical relationships from data, but applies predefined rules to interpret measured SSC parameters.
To implement this approach, a system of interpretation matrices has been developed, enabling mapping of SSC parameter deviations to physically grounded structural mechanisms.
For clarity, the overall workflow of the proposed approach is illustrated in Fig. 2.
A compact example demonstrating the predictive linkage between SSC parameters, structural state, electro-thermal behavior (Δ), and DCL reliability is provided in Appendix A.
AI-Assisted Structural Diagnostics Framework
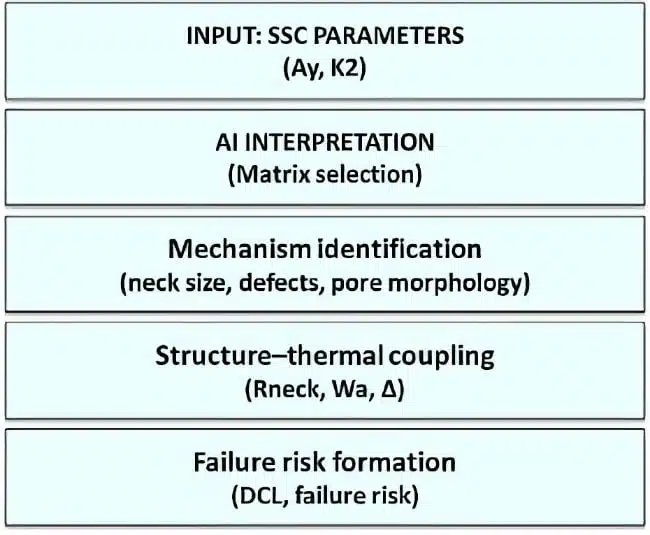
Fig. 2. AI-assisted structural diagnostics framework linking SSC parameters to structural mechanisms, structure–thermal coupling, and reliability (DCL). The interpretation is based on predefined physics-based matrices.
The scheme illustrates the sequential interpretation process, where SSC parameters (Ay, K2) are used as input to an AI-based matrix selection system, enabling identification of dominant structural mechanisms (neck geometry, defects, pore morphology). The resulting structural interpretation is further linked to thermal response (Rneck, Wa, Δ) and ultimately to reliability, expressed through DCL behavior.
The anode thermal model used in this work is based on a previously developed framework [1], in which the relationships between interparticle neck geometry, electrical resistance, local heat generation, and thermal balance (Δ) were established.
Physical Basis for SSC Parameter Interpretation
For batches produced from the same powder (identical CV/g) and under unchanged processing conditions, the yield strength Ay is considered the dominant integral parameter of the porous framework.
The physical nature of Ay and K2 is fundamentally different.
Ay is governed primarily by local effects and reflects the onset of plastic deformation in the most highly stressed microvolumes, particularly at interparticle contacts (necks), where their size is minimal. Therefore, Ay characterizes the effective load-bearing cross-section of the porous structure.
In contrast, K2 is a volume-averaged parameter associated with defect accumulation, stress redistribution, and mechanisms of plastic deformation development. It reflects the structural state throughout the entire volume of the sample.
Within this framework, the following assumptions are adopted:
- a decrease in Ay corresponds to geometrical weakening of the structure, primarily due to reduction of effective neck size;
- an increase in Ay is associated with defect- or interface-controlled strengthening;
- K2 serves as a refinement parameter characterizing post-yield deformation behavior and the level of defect involvement in the structure.
In cases where K2 remains approximately constant relative to the benchmark, its influence on Ay is considered negligible. Under such conditions, variations in Ay are attributed primarily to geometrical factors, particularly changes in interparticle neck size.
In the present work, the modulus-related parameter E (or its practical analogue k1) is not used as a primary interpretation parameter. Although it reflects the stiffness of the porous framework, it is influenced not only by pore structure but also by impurity content, oxygen state, and other chemical–mechanical factors that do not necessarily correspond to changes in porosity.
In contrast, capacitance is much less sensitive to impurity-related effects and is more directly associated with the porous architecture of the anode. Since the objective of this study is to identify structural deviations relevant to DCL reliability, the interpretation is based primarily on Ay, as a local neck-sensitive parameter, and on K2, as a parameter reflecting defect distribution and deformation mechanisms. The parameter E (or k1) is therefore treated as a secondary or supporting indicator rather than a primary diagnostic variable.
Critical Interpretation Rules
The application of the interpretation matrices is governed by the following rules:
Primary parameter — Ay
Ay is the dominant indicator of the load-bearing capacity of the porous framework and is primarily controlled by interparticle neck geometry.
Secondary parameter — K2
K2 reflects volume-averaged deformation behavior and is sensitive to defect distribution, stress state, and deformation mechanisms.
The interpretation is governed by a consistency rule linking Ay and K₂ behavior.
Special condition — deoxidation
If the processing temperature is insufficient to modify the porous framework geometry, simultaneous decreases in Ay, k1, and K2 are interpreted as relaxation of the oxygen-controlled stress–defect state, rather than structural degradation.
In this framework, A<sub>y</sub> primarily reflects the geometric contribution of interparticle necks, including their effective cross-section and load-bearing capacity, whereas K₂ reflects defect-related and stress-related contributions associated with deformation heterogeneity, local structural instability, and their impact on local resistivity and film-growth stability.
Table 1 — Unified Interpretation Matrices for SSC Parameters
| Matrix | Condition | Dominant Mechanism | Interpretation | Engineering Conclusion |
| Matrix 1A | Ay↓, K2≈ | geometry-controlled (neck-controlled) | Reduction of effective neck size and load-bearing cross-section; minimal defect contribution | Structural problem in sintered pellet (powder morphology/pore structure) |
| Matrix 3 | Ay≈, K2↑ | defect-controlled (stress / interfacial heterogeneity) | Change in deformation mechanism associated with increased defect contribution, interfacial heterogeneity, and localized deformation; neck geometry remains largely unchanged | Borderline structural state with increased sensitivity to defect-related effects; requires additional verification due to potential impact on local conductivity and reliability |
| Matrix 4 | Ay≈, K2≈, DCL fail | formation-controlled | Mechanical parameters correspond to the benchmark; structure is not the root cause | The problem originates from the formation process |
| Matrix 5 | Ay↑, K2↑ | interface / defect-controlled | Strengthening associated with interface effects (e.g., passivation oxide on neck surfaces) | Increased risk of defect formation in Ta₂O₅ dielectric film |
| Matrix D1 | (Ay↓, k1,↓K2↓) after deoxidation (constant framework geometry) | relaxation-controlled / oxygen-state-controlled | Reduction of oxygen-related strengthening and internal stress; relaxation of defect contribution without change in neck geometry | Improved structural state due to deoxidation; expected improvement in reliability |
| Matrix 2 | Ay↓, K₂↑ | mixed (geometry + defect / interfacial) | Combined reduction of effective neck size and increased defect/interfacial contribution; simultaneous change in load-bearing cross-section and deformation mechanism | Structurally degraded state with coupled geometric and defect-related effects; high sensitivity to processing variations and increased risk of reliability degradation |
Table 1 — Structural SSC matrix for classification of sintered anode states based on Ay and K₂, reflecting neck geometry, defect contribution, and deformation behavior of the porous framework.
Note:Matrix 2 represents the most critical condition, where geometric and defect-related mechanisms act simultaneously, leading to the strongest degradation of thermal stability and the highest DCL failure risk.
However, structural classification alone does not directly explain the resulting electrical behavior during anodization.
However, structural classification alone does not directly explain the resulting electrical behavior during anodization.
Importantly, the matrix classification reveals that identical processing conditions do not necessarily lead to identical structural states.
Even for powders of the same nominal type and under the same sintering regime, variations in particle morphology and agglomerate behavior may result in significantly different neck geometry and defect distribution, which are captured by the SSC parameters.
To address this, the matrix system is extended in Table 2 by introducing an electro-thermal interpretation layer (E-layer), where each structural class is linked to its corresponding effect on local electrical resistance, heat dissipation, thermal margin (Δ), and oxide-growth stability.
In this two-layer framework, the first matrix answers the question of what has changed in the structure, while the second explains how these structural changes affect formation conditions and reliability outcomes.
Thus, the SSC matrix system is extended from structural classification to physics-based reliability interpretation.
In this formulation, the SSC matrix is no longer limited to identifying structural deviations but provides a direct physical pathway connecting structure to electro-thermal behavior and reliability during formation.
Within the proposed framework, structural deviations identified by the SSC matrix are directly linked to the thermal behavior of the anode through the parameter Δ, which characterizes the balance between heat generation and heat removal.
Changes in neck geometry and defect structure modify local resistance and heat dissipation conditions, thereby shifting the system toward or away from overheating regimes during formation.
Table 2— Electro-Thermal Interpretation of SSC Matrices (E-layer)
| Matrix | Condition | Dominant Mechanism | Interpretation | Engineering Conclusion |
| Matrix 1AE | Ay↓, K₂≈ | geometry-controlled (neck-related electro-thermal effect) | Reduction of the effective neck cross-section increases local electrical resistance and decreases heat dissipation capability in the oxide growth region | Thermal margin decreases (Δ ↓); increased risk of local overheating during formation and DCL failure |
| Matrix 3E | Ay≈, K₂↑ | defect-controlled (interfacial / resistivity-driven | Increase in K₂ reflects higher defect density and interfacial effects (e.g., oxide layers), leading to increased effective resistivity and non-uniform current distribution without significant change in neck geometry | Localized overheating (hot spots) due to resistivity and contact effects; local decrease in Δ; increased risk of DCL instability and non-uniform oxide growth |
| Matrix 4E | Ay≈, K₂≈, DCL fail | formation-controlled (electro-thermal process-driven) | Structural parameters correspond to the benchmark; deviations arise during anodization due to current distribution, electrolyte conditions, or formation regime | Local disturbance of thermal balance during formation; oxide-growth instability is the dominant failure mechanism |
| Matrix 5E | Ay↑, K₂↑ | interface-controlled (interfacial resistivity effect) | Strengthening associated with interfacial layers (e.g., oxide on neck surfaces) increases interfacial electrical resistance and modifies local heat flow conditions | Increased probability of local overheating and non-uniform Ta₂O₅ growth; elevated DCL failure risk |
| Matrix D1E | (Ay↓, k₁↓, K₂↓) | relaxation-controlled (oxygen-state electro-thermal effect) | Reduction of oxygen-related resistivity and internal stress improves current uniformity and heat dissipation without changing framework geometry | Thermal margin increases (Δ ↑); reduced overheating tendency; improved oxide growth stability and reliability |
| Matrix 2E | Ay↓, K₂↑ | combined electro-thermal (geometry + resistivity-driven) | Reduction of neck cross-section increases local resistance, while increased defect/interfacial contribution further raises effective resistivity and disrupts current distribution | Strong increase in local heat generation and reduced heat dissipation; significant decrease in Δ (Δ ↓↓); highest risk of local overheating and DCL failure |
Table 2 — Extended electro-thermal mapping (E-layer) of SSC matrix classes, translating structural deviations into their impact on local resistance, heat transfer, thermal margin (Δ), oxide-growth conditions, and DCL-related reliability.
The matrix system serves as a knowledge-based framework, where each SSC signature is mapped to its corresponding structural mechanism and electro-thermal consequence.
Consistency Rule
In a physically consistent system, variations in K2 are expected to influence Ay, reflecting the coupling between defect accumulation and the load-bearing capacity of the porous framework.
Accordingly:
- correlated changes (Ay↑, K2↑, or Ay↓ with K2↓) indicate defect- or interface-controlled behavior;
- decoupled changes (Ay↓ with K2≈ or K2↑) indicate geometry-controlled effects, primarily associated with interparticle neck size.
This rule enables discrimination between defect-driven and geometry-driven structural deviations.
Matrix codes do not represent empirical categories; they represent physically interpretable structural states associated with a limited set of dominant mechanisms.
In this framework, the matrix is not trained — it is physically parameterized.
Structural-to-Thermal Coupling
For geometry-controlled cases (Matrix 1A), the structural interpretation is directly coupled with the thermal model, enabling prediction of local overheating conditions.
The anode thermal model used in this work is based on a previously developed framework [1], in which the relationships between interparticle neck geometry, electrical resistance, local heat generation, and thermal balance (Δ) were established.
Structure → Thermal Behavior → Reliability
For Matrix 1A, the structural change translates into thermal behavior as:
X↓⇒Sneck↓⇒Rneck↑⇒Wa↑
where:
- X — neck size
- Rneck — local resistance
- Wa — local heat generation
This results in:
• localized overheating during formation,
• non-uniform oxide growth,
• increased probability of DCL failure.
Thermal Risk Parameter
Δ=Qrem/Qgen
• Δ > 1 — safe regime
• Δ ≈ 1 — marginal stability
• Δ < 1 — overheating risk
A reduction in neck size increases local heat generation and reduces heat dissipation efficiency, leading to a decrease in Δ and a higher probability of failure.
Thus, geometry-controlled structural deviations directly translate into electro-thermal instability during formation.
Key Conclusion
SSC parameters enable not only the identification of structural deviations but also the prediction of thermal instability during formation, establishing a direct link between mechanical characteristics and reliability.
The present work builds upon the previously developed anode thermal model [1] by introducing a matrix-based AI-assisted interpretation framework.
Implementation and Practical Use
The proposed approach is implemented using two complementary components:
(i) a matrix-based interpretation framework for AI-assisted structural diagnostics, and
(ii) an anode thermal model enabling quantitative evaluation of thermal risk (Δ).
The matrix system provides a structured mapping of SSC parameter deviations (Ay, K₂) to physically grounded structural mechanisms, while the thermal model translates these structural features into electro-thermal behavior through parameters such as local resistance (Rneck), heat generation (Wa), and thermal margin (Δ).
In practical application, measured SSC parameters are used as input to an AI-assisted system, where deviation detection and matrix selection are performed automatically, followed by physics-based interpretation and thermal risk evaluation.
The interpretation matrices and the anode thermal model are provided as supporting materials [1, 2] and can be used together as an integrated workflow for reliability assessment.
Thus, the proposed approach represents not only a diagnostic method but a complete framework for AI-assisted evaluation of structural and electro-thermal reliability of tantalum capacitor anodes.
Conclusion
This work presents a physics-based framework for structural diagnostics of sintered tantalum capacitor anodes using stress–strain curve (SSC) parameters, with artificial intelligence (AI) employed as an interpretation tool.
It is shown that SSC parameters, primarily the yield strength Ay and the strain-hardening coefficient K2, act as integral descriptors of the porous framework, reflecting both the load-bearing cross-section of interparticle necks and the volume-averaged defect and stress state.
A system of interpretation matrices has been developed to map deviations in SSC parameters to physically grounded structural mechanisms, including neck geometry variations, defect- and interface-controlled effects, and relaxation processes associated with deoxidation.
Formal interpretation rules are introduced, including the dominant role of Ay, the refinement role of K2, the consistency rule, and the deoxidation-specific condition, enabling unambiguous identification of underlying mechanisms and preventing misinterpretation of SSC data.
Structural variations identified through SSC parameters are directly linked to thermal behavior during formation via the chain:
structure → Rneck → Wa → Δ → reliability
This establishes a predictive connection between mechanical response and failure risk, enabling early identification of local overheating and DCL instability.
Within this framework, AI is not used to derive empirical correlations but to apply predefined physics-based interpretation rules and matrices to experimental data.
Thus, SSC parameters are transformed from descriptive mechanical characteristics into a quantitative tool for structural diagnostics and early-stage reliability assessment.
The proposed methodology can be used for in-process structural control of sintered anodes and for reducing reliability risks in high-reliability applications.
Appendix A — Example of AI-Assisted Interpretation of SSC Data
A.1 Experimental Observation
An experimental comparison was performed for batches produced from tantalum powders with nominally identical specific capacitance (CV/g) and processed under identical technological conditions.
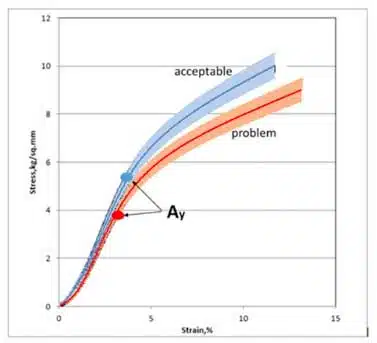
Fig. A1. Stress–strain curves of sintered tantalum pellets: comparison of acceptable (benchmark) and problematic batches. A reduction in yield strength (Ay) is observed for the problematic batches, while post-yield behavior remains comparable.
| Avr.40 batches | STDEV | Avr.4 batches | STDEV | |
|---|---|---|---|---|
| SPD (g / in²) | 31.2 | 0.4 | 32 | 0.31 |
| Crush (lbs) | 10.3 | 1.8 | 10.7 | 1.36 |
| C (ppm) | 2221.1 | 123.5 | 2336.5 | 104.45 |
| Cl (ppm) | 19 | 9.8 | 35.8 | 7.05 |
| Pellet conditions | ||||
| Form/binder Vol(%) | 30 | 30 | ||
| Sinter Density (g/cc) | 5.5 | 0.1 | 5.25 | 0.07 |
| Shrinkage length (%) | 1.5 | 0.8 | 0.6 | 0.62 |
| Shrinkage diameter (%) | 3.3 | 0.8 | 2.0 | 0.51 |
| F (k) | 78.3 | 5.4 | 74.4 | 4.7 |
| Volume Shrinkage (%) | 10 | 5 | ||
| C/V (mF/L) | 38101 | 1042 | 37265.3 | 1594 |
| DCL/CV (nA/mF/V) | 1 | 0.2 | 3.4 | 1.53 |
| DF (%) | 4.1 | 3.4 | 65.6 | 34.72 |
Table 1A— Comparison of batches using conventional characterization parameters. Despite nearly identical process conditions and bulk properties, a significant deviation in Ay was observed, revealing structural differences not captured by standard methods.
Despite similar CV/g, a significant difference in electrical performance was observed:
· reference batches: DCL fail ≈ 3–4%
· problem batches: DCL fail ≈ 35–65%
The corresponding SSC parameters are:
· reference: Ay ≈ 5.5 kg/mm², K₂ ≈ 0.6
· problem: Ay ≈ 3.8 kg/mm², K₂ ≈ 0.5
Thus, the dominant deviation is:
Ay ↓, K₂ ≈
A.2 AI-Based Matrix Selection
Based on predefined interpretation rules, the AI system identifies:
→ Matrix 1A (geometry-controlled case)
→ Matrix 1AE (electro-thermal extension)
The selection is driven by the decrease in Ay, while K₂ remains approximately unchanged, indicating a geometry-dominated structural deviation.
A.3 Physical Interpretation
According to Matrix 1A, the dominant mechanism is:
→ reduction of effective interparticle neck size
→ decrease in load-bearing cross-section
→ minimal contribution from defect-related effects
Given that CV/g remains similar, the most probable origin is variation in powder morphology, including particle size distribution and pore structure.
A.4 Structural → Electro-Thermal Mapping
The structural interpretation (Matrix 1A) is directly mapped to its electro-thermal counterpart (Matrix 1AE):
X ↓ ⇒ Sneck ↓ ⇒ Rneck ↑ ⇒ Wa ↑ ⇒ Δ ↓
This results in:
· increased local electrical resistance;
· increased local heat generation during formation;
· reduced thermal margin (Δ);
· increased probability of local overheating.
A.5 Explanation of DCL Degradation
The reduction in thermal margin (Δ ↓, approaching or falling below unity) leads to:
→ local overheating during anodization;
→ non-uniform oxide growth;
→ local defect formation in Ta₂O₅;
→ increased probability of leakage current failure.
This explains the observed increase in DCL failure rate from ~3–4% to ~35–65%.
A.6 Engineering Conclusion
The AI-assisted interpretation indicates that:
· the root cause is located in the sintered pellet structure rather than in the formation process;
· the dominant mechanism is reduction of interparticle neck size;
· the structural deviation originates from powder-to-powder variation despite nominally identical specifications;
· the resulting electro-thermal condition corresponds to Matrix 1AE, indicating reduced thermal stability during formation.
A.7 Significance of the Example
This example demonstrates that the proposed AI-assisted framework:
· operates strictly within physically predefined interpretation rules;
· distinguishes geometry-controlled deviations under identical process conditions;
· integrates structural (A-layer) and electro-thermal (E-layer) interpretation;
· provides a predictive pathway linking SSC parameters to thermal stability (Δ) and reliability outcomes before electrical testing.
Appendix B — Example of AI-Assisted Matrix Interpretation
Input Data (Analyzed Case)
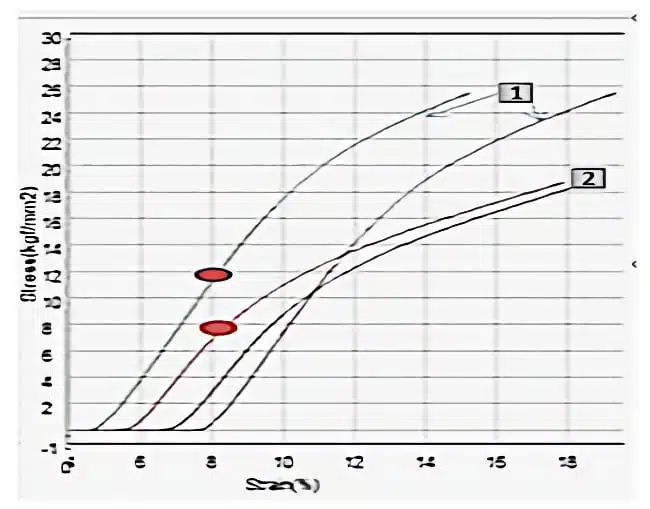
Fig. 1B
In Fig.1B, the CC curves of sintered pellets, produced at the same sintering and formation recipe, but with different vendors’ powder.
| SSA, m²/g (CV%) | Vendor | Press dens | T°C/min | Shrink % | Sint. dens | Porosity % | Cap, µF | CV/g | DCL | AY, kg/mm | k₂ |
|---|---|---|---|---|---|---|---|---|---|---|---|
| 0.06 (25–35) | (Ref1) | 9.1 | 2100/90 | 8.1 | 9.8 | 41 | 12.6 | 2224 | pass | 12 | 0.7 |
| 0.06 (25–35) | 2 | 9.1 | 2100/90 | 7.3 | 9.75 | 42 | 12.1 | 2118 | fail | 8 | 0.65 |
Table 1B — Conventional parameters show no significant differences between batches, while A<sub>y</sub> reveals a critical structural deviation.
· Powder type: nominally identical CV/g, different suppliers
· Processing conditions: identical
· Measured SSC parameters:
Ay: 12 → 8 kg/mm²
K₂: 0.70 → 0.65
AI Interpretation Output
Selected matrix (structural layer):
Matrix 1A
Electro-thermal mapping (E-layer):
Matrix 1AE
Reason
Significant decrease in Ay with only minor variation in K₂ indicates a geometry-controlled structural deviation.
Dominant Mechanism
Geometry-controlled weakening of the porous framework.
Structural Interpretation
Reduction of effective interparticle neck size and load-bearing cross-section, resulting in decreased structural connectivity.
Probable Technological Origin
Powder-to-powder variation between suppliers, reflected in differences in particle size distribution, agglomerate stability, and resulting pore morphology.
Process Condition Note
The observed structural deviation occurs under identical processing conditions, confirming that process parameters do not uniquely define the resulting porous structure.
Electro-Thermal Consequence (E-layer)
Reduction of neck size leads to:
· increase in local electrical resistance (Rneck ↑);
· increase in local heat generation (Wa ↑);
· reduction in heat dissipation capability;
Resulting in:
→ thermal margin reduction (Δ ↓)
→ transition toward local overheating conditions (Δ → 1 or Δ < 1)
Reliability Consequence
Local overheating during formation leads to:
· non-uniform oxide growth;
· increased defect formation in Ta₂O₅;
· increased probability of DCL-related failures.
AI–Physics Linkage
Matrix 1A (structural layer) is directly mapped to Matrix 1AE (electro-thermal layer), establishing a physical pathway:
structure → Rneck → Wa → Δ → reliability
Very Brief Engineering Interpretation
For powders of the same nominal type supplied by different vendors, the observed reduction in Ay with nearly unchanged K₂ indicates a neck-controlled structural deviation.
Under identical processing conditions, this difference originates from powder characteristics and manifests as a reduction in thermal margin (Δ ↓), leading to local overheating and increased DCL failure risk.
Significance of the Example
This example demonstrates that matrix-based AI interpretation:
· is physics-based rather than data-driven;
· separates structural and electro-thermal mechanisms;
· links SSC parameters directly to thermal risk (Δ);
· enables early-stage prediction of reliability degradation.
References
- Structural Interpretation of Reliability in Tantalum Capacitor Anodes https://doi.org/10.5281/zenodo.18669844 version 2
- SSC Interpretation Matrix Framework for AI-Assisted Structural Diagnostics of Tantalum Capacitor Anodes. DOI: https://doi.org/10.5281/zenodo.19404430