








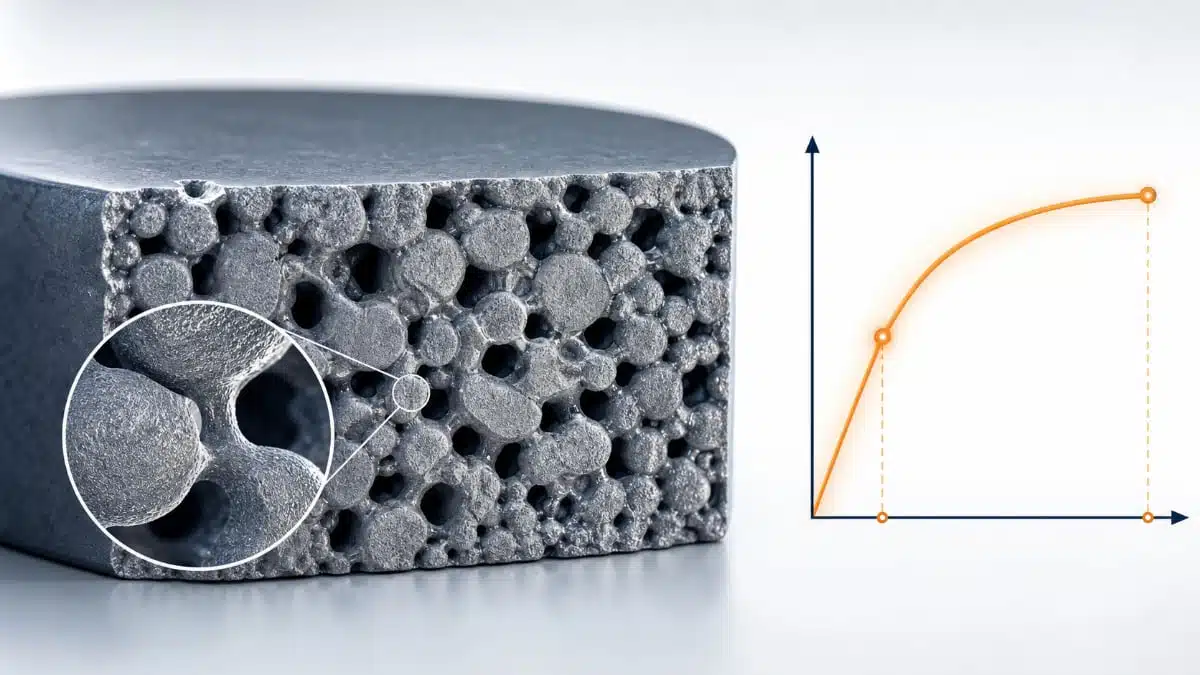
This article based on edited report written by Vladimir Azbel, Ph.D., a semiconductor process reliability engineer consultant, explains and discuss why stress–strain curves are the key tools to diagnose tantalum powders and thus it helps to enhance and predict tantalum capacitors reliability.
Tantalum capacitors are among the most reliable passive components used in demanding electronics — from medical devices and aerospace systems to automotive and industrial equipment. Their performance depends critically on the quality of the tantalum powder used to form the porous anode structure inside each capacitor. Yet even powders that pass all standard quality checks can occasionally produce anodes with unstable leakage current — a serious reliability risk that is difficult to catch before it causes failures in the field.
This article presents a practical diagnostic approach that goes beyond conventional powder inspection. By applying mechanical stress–strain curve (SSC) analysis to sintered tantalum pellets — the direct precursors of capacitor anodes — it is possible to detect subtle changes in powder morphology before anodization begins and before any electrical problems appear. The method, long established in powder metallurgy, has rarely been applied to tantalum capacitor production. The case study described here shows why it should be.
Why look at mechanical behavior of tantalum powders?
Tantalum capacitor manufacturers usually evaluate incoming powder quality through the supplier’s Certificate of Analysis (COA) and basic electrical tests on control anodes. Even when all COA parameters are within specification, leakage current (DCL) stability can still differ significantly between batches.
In the case described here, a capacitor producer processed about forty acceptable batches from one tantalum powder lot, followed by several “problem” batches with increased DCL. Standard measured parameters, including chemical composition, stayed within specification, yet three clear trends appeared:
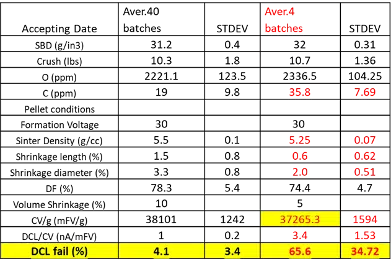
- DCL increased
- Specific capacitance (CV/g) tended to decrease
- Pellet shrinkage after sintering decreased
These changes pointed to a modification in powder morphology (particle size distribution, neck formation) that conventional COA and basic electrical tests did not reveal. To identify the root cause, the manufacturer used mechanical testing with stress–strain curve (SSC) recording on sintered control pellets.
A key point is that the sintered porous pellet used for SSC measurements is the same precursor that will later be anodized and become the functional capacitor anode. Yet in most production flows this pellet is not used for direct structural diagnostics.
What is an SSC and why is it useful?
In powder metallurgy, the stress–strain curve is a standard tool to characterize materials produced by pressing and sintering powders. For tantalum capacitor powders, the same approach can be applied: press and sinter standard control pellets, then record their mechanical response under load.
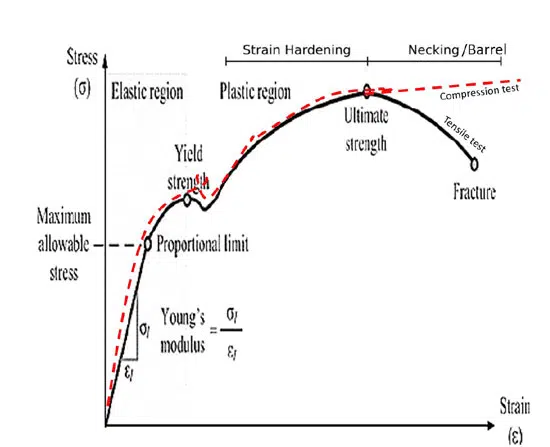
From the SSC, three main parameters are extracted:
- Young’s modulus (E) – stiffness of the porous pellet, related to overall porosity and rigidity
- Yield strength (Ay) – onset of plastic deformation, strongly influenced by the geometry of interparticle necks
- Strain‑hardening coefficient (K2) – behavior in the early plastic/strain‑hardening region, sensitive to structural defects and deformation mechanism
These parameters are not just generic mechanical values. They reflect how the powder morphology and sintering process build the porous network that later defines the electrical performance of the anodized anode. When powder and process are optimized, the SSC parameters fall within a characteristic window associated with good electrical performance and reliability.
How SSC parameters reflect porous structure
For porous materials such as sintered tantalum pellets, the mechanical parameters have clear structural interpretations.
Young’s modulus E: stiffness and porosity
For a porous pellet, Young’s modulus can be expressed in a simplified form as:
E=E0×(1−p/pc)
where E is the modulus of the porous pellet, E0 is the modulus of the fully dense material, p is density, and pc is a critical density parameter.
In practice, lower E corresponds to a more compliant structure, typically associated with higher porosity or a weaker load‑bearing framework. Changes in E therefore reflect changes in the rigidity and porosity of the pellet skeleton.
Yield strength Ay: neck size vs particle size
The yield strength of a porous pellet is dominated by the geometry of interparticle contacts (necks). A widely used relationship expresses Ay as:
Ay=b×Ay0×(X/D)2
where X is interparticle neck size, D is primary particle size, Ay0 is yield strength of the fully dense material, and b is an empirical factor.
Ay is thus a sensitive indicator of the neck‑size‑to‑particle‑size ratio (X/D) and reflects the morphology of the formed porous structure. If PSD shifts toward coarser particles or necks become smaller, Ay decreases even if the overall porosity remains similar.
Strain‑hardening coefficient K2: deformation mechanism and defects
K2 describes the early strain‑hardening region of the SSC – how the material work‑hardens once plastic deformation has started. It is particularly sensitive to:
- Structural defects
- Strain localization
- Disruptions in the continuity of the load‑bearing framework
K2 therefore indicates whether the pellet deforms via a stable, homogeneous mechanism or via early localization and cracking caused by defects.
In summary:
- E reflects overall stiffness and porosity
- Ay characterizes the neck‑size‑to‑particle‑size ratio
- K2 reflects the deformation mechanism and sensitivity to structural imperfections
Analyzing E, Ay, and K2 together transforms the SSC from a purely mechanical test into a structural diagnostic tool for porous tantalum pellets.
Focusing on the most informative part of the SSC
For structural diagnostics, it is not necessary to analyze the entire curve up to fracture. The most informative region is the transition from elastic to plastic deformation, including the initial strain‑hardening stage.
In this working region:
- Ay marks the onset of permanent (plastic) deformation
- E (or a near‑elastic slope parameter K1) characterizes stiffness
- K2 describes how the pellet hardens after yielding
This region is especially sensitive to:
- Geometry of interparticle contacts
- Morphology of the porous structure
- Tendency toward strain localization
- Integrity of the load‑bearing framework
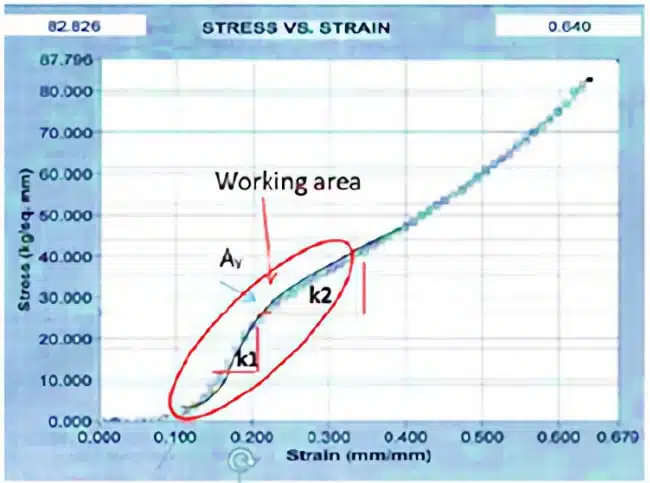
By standardizing how this region is measured and interpreted, manufacturers can build a consistent SSC‑based diagnostic for incoming powders and for process stability monitoring.
Case study: acceptable vs problem batches
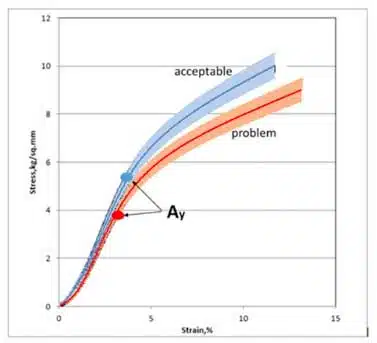
In the examined case, SSC curves were obtained for pellets made from both acceptable and problem batches of the same tantalum powder lot. The derived parameters E, Ay, and K2 were then compared.
The results showed:
- Reduction of E by approximately 10–15%
- Reduction of Ay by 15–25%
- K2 remained close to the values observed for acceptable batches
The combination of reduced Ay with stable K2 was particularly informative. If structural degradation had been caused by typical technological defects such as pressing cracks, contamination, or local sintering problems, K2 would generally change first, since it is highly sensitive to strain localization and disruptions in structural continuity.
However, K2 remained close to reference levels, indicating that the deformation mechanism of the porous pellet stayed typical for this structure and no gross structural defects were present.
This pattern points to a different cause: a systematic change in the neck‑to‑particle size ratio (X/D)², as reflected in the drop in Ay. In practice this means:
- Reduction in interparticle neck size X
- Increase in primary particle size D
- Or a combination of both
The most probable cause is a shift in particle size distribution (PSD) toward a larger coarse‑particle fraction. This is consistent with:
- Tendency toward lower CV/g
- Reduction in pellet shrinkage
- Lower sintering activity due to larger particles
In other words, problem batches have a modified internal geometry of interparticle contacts, even though conventional COA parameters did not indicate significant differences.
Why PSD is especially critical for tantalum powders
For many traditional powder products, moderate PSD deviations may not significantly affect functional properties. For porous tantalum pellets used in capacitors, even small PSD shifts can strongly influence:
- Geometry of interparticle contacts
- Neck size X and ratio X/D
- Local distribution of electric and thermal fields after anodization
Several factors make tantalum pellets particularly sensitive:
- Very high structural porosity
- Small neck sizes in the load‑bearing framework
- Subsequent anodization that converts the porous body into a dielectric network
- Strong localization of current and heat in interparticle contact regions
As a result, relatively small changes in powder morphology may lead to a significant increase in DCL instability risk, even when standard COA parameters show almost no differences. SSC analysis, which captures the structural consequences of PSD shifts, is therefore especially valuable as an incoming inspection method for tantalum powders.
From mechanical test to structural acceptance criterion
Using mechanical tests as structural acceptance criteria is a well‑established practice in many areas of powder metallurgy. What is new here is the direct application of this approach to tantalum powders for capacitor production.
A practical implementation can be summarized in four steps:
- During powder development, the supplier explores multiple PSD variants and sintering conditions.
- For each variant, SSC parameters E, Ay, and K2 are measured on sintered pellets.
- These SSC parameters are correlated with the electrical performance and reliability stability of qualified tantalum capacitor anodes (e.g. DCL behavior, failure rates).
- Based on these correlations, an acceptable structural window for E, Ay, and K2 is defined for a given capacitor design class.
Once this “SSC window” is defined, the SSC curve becomes a benchmark‑based structural acceptance criterion for:
- Incoming powder inspection
- Verification of process stability
- Early detection of deviations in powder morphology
For a fixed qualified powder type and technological recipe, systematic SSC deviations after sintering or during subsequent steps (e.g. lead attachment) indicate process instability, because the primary powder morphology is largely determined by the supplier. In this approach, acceptable limits for E, Ay, and K2 are physically linked to the structural state required for stable capacitor reliability, rather than to purely empirical mechanical tolerances.
Summary – Practical implications for tantalum capacitor manufacturing
The obtained results show that SSC analysis can reveal structural changes in powder morphology even in cases where standard COA parameters show almost no differences.
Key takeaways:
- The combined analysis of E, Ay, and K2 makes it possible to distinguish between:
- Structural defects (cracks, pressing issues, contamination)
- Changes in powder morphology (PSD, neck geometry)
- Technological process disturbances
- A pattern of stable K2 values together with reduced Ay indicates not gross defects in the porous pellet, but a systematic change in interparticle contact geometry, most likely associated with changes in PSD of the primary powder particles.
- The SSC curve can therefore be considered a sensitive structural indicator that allows evaluation of the ability of tantalum powder to form the required porous structure before anodization and before the appearance of electrical failures.
Incorporating SSC‑based diagnostics into incoming inspection provides an additional layer of structural control that complements standard chemical and electrical measurements, and helps to stabilize leakage current behavior in tantalum capacitor production.
Conclusion
Standard incoming powder inspection based on chemical and dimensional parameters (COA) is a necessary but not always sufficient safeguard for tantalum capacitor production. As the case study in this article demonstrates, batches that fully comply with COA specifications can still carry structural deviations in powder morphology that eventually translate into elevated leakage current and increased DCL failure rates.
Stress–strain curve analysis of sintered control pellets provides a complementary structural window that COA cannot offer. By tracking three parameters — Young’s modulus (E), yield strength (Ay), and strain-hardening coefficient (K2) — manufacturers can distinguish between gross structural defects and subtle shifts in particle size distribution or interparticle neck geometry. The diagnostic signature identified here — reduced Ay with stable K2 — is particularly valuable: it points specifically to changes in the neck-to-particle size ratio rather than to catastrophic damage, enabling targeted corrective action.
The practical implication is straightforward: establishing an SSC-based structural acceptance window during powder qualification, and applying it routinely in incoming inspection, adds a sensitive early-warning layer to the quality control chain. For a component class where reliability is non-negotiable, that additional layer can make a meaningful difference.