
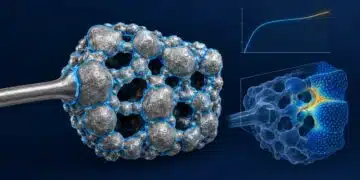






Vladimir Azbel, Ph.D., has outlined a tantalum capacitor anode development approach that combines commercial reference anodes, stress–strain curve analysis and process modeling to narrow the experimental search for new designs.
The method uses the structural characteristics of an existing reference design as a benchmark, then identifies candidate processing conditions compatible with the developer’s available powders and equipment.
The reported investigation covers six experimental designs, with 1,000-hour electrical results presented for four. Its potential value lies in making development more targeted—not in replacing pilot production, electrical testing or product qualification.
Moving Beyond Initial Capacitance and Leakage Measurements
Developing a new tantalum capacitor anode requires balancing powder characteristics, pressing density, sintering conditions and dielectric formation. Changing one parameter can require another pilot lot and a fresh round of electrical evaluation.
Azbel’s approach adds a structural target to this process. Rather than starting only from required capacitance and direct current leakage, or DCL, it also considers the mechanical response of a reference anode recovered from a commercial capacitor.
The objective is not to reproduce another manufacturer’s proprietary process. Instead, the reference provides an experimentally realized benchmark against which candidate structures and formation conditions can be assessed.
What Stress–Strain Curves Contribute
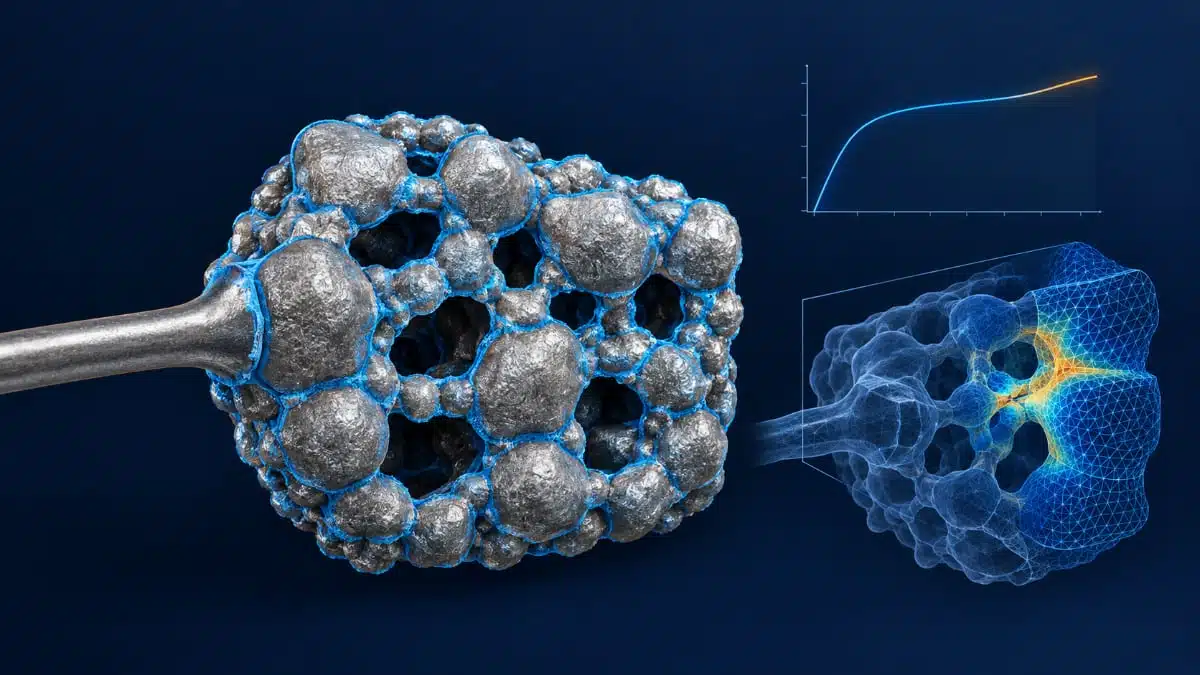
Stress–strain curve analysis, abbreviated SSC, measures the mechanical response of the anode under loading. For a formed anode, this response reflects the combined behavior of the porous tantalum skeleton, its interface region and the tantalum pentoxide dielectric.
This distinction matters because a formed anode is not simply a porous metal framework. Dielectric growth changes the remaining metallic cross-section of interparticle connections and contributes to the internal stress state.
Comparing the complete SSC response with a reference can therefore provide information beyond initial capacitance and leakage measurements. However, matching curves does not establish identical nanoscale interfaces, prove the absence of local defects or guarantee long-term electrical stability.
Six Designs Address Different Adaptation Challenges
The six experimental designs span low-voltage, high-voltage and high-capacitance requirements. Their adaptation objectives differ: the high-voltage designs emphasize interparticle neck structure and formation conditions, while the high-capacitance design emphasizes anode thickness, impregnation and pore accessibility.
| Rating | Case | Design type | Primary adaptation objective |
|---|---|---|---|
| 10 µF–50 V | D | High voltage | Neck structure and formation thermal regime |
| 15 µF–63 V | H | High voltage | Powder and high-voltage formation adaptation |
| 6.3 µF–100 V | H | High voltage | Reduced formation-overheating risk |
| 47 µF–10 V | B | Low voltage | Porosity, CAP, and cathode-process compatibility |
| 100 µF–6.3 V | B | Low voltage | High specific charge and structural reproducibility |
| 1000 µF–6.3 V | E | High capacitance | Anode thickness, impregnation, and pore accessibility |
From Reference Anode to Candidate Process
The proposed development sequence connects physical measurements, modeling and experimental verification. Reference-anode characterization establishes the target; modeling narrows the possible process conditions; and experimental anodes are then checked against both structural and electrical criteria.
- Recover and characterize a reference anode through controlled stripping.
- Measure its mass, dimensions, density, capacitance and SSC response, and estimate its formation voltage.
- Use the geometric and electrical inputs to calculate a possible structure for the original sintered pellet.
- Estimate compatible processing conditions, including powder class, pressing density, shrinkage, post-sinter density and interparticle neck development.
- Select formation conditions using the calculated structure.
- Produce experimental anodes and compare their SSC response, capacitance and DCL with the reference.
- Use life-test results to guide the next model and process iteration.
The model generates a domain of possible processing conditions rather than a uniquely reconstructed recipe. This allows the developer to work toward a comparable outcome using locally available materials and production capabilities.
Sintering and Formation Are Evaluated Together
The method treats the sintered framework and dielectric formation as coupled design decisions. During formation, tantalum pentoxide grows over accessible internal surfaces. Formation conditions therefore need to be considered alongside the metallic cross-section remaining in interparticle necks and the thermal conditions within the porous structure.
The experimental matrix combines two sintering temperatures—15 °C below and above the calculated temperature—with two formation-current levels. This creates four variants around the modeled process condition.
| Sintering condition | Formation current I1 | Formation current I2 |
|---|---|---|
| Tcalc − 15 °C | Variant 1 | Variant 2 |
| Tcalc + 15 °C | Variant 3 | Variant 4 |
These temperature offsets describe the reported investigation, not universal process recommendations. Candidate selection should consider the complete SSC response together with capacitance, DCL and formation conditions, rather than optimizing one measurement independently.
What the 1,000-Hour Results Show
The supplied results compare initial DCL with DCL after 1,000 hours for four experimental designs. The DCL ratio expresses the final leakage current relative to its initial value, while ΔCAP reports the percentage change in capacitance.
| Experimental design | DCL, 0 h (µA) | DCL, 1000 h (µA) | DCL1000/DCL0 | ΔCAP |
|---|---|---|---|---|
| 100 µF–6.3 V, B | 0.613 | 0.684 | 1.12 | −4.3% |
| 47 µF–10 V, B | 0.465 | 0.597 | 1.28 | −5.2% |
| 10 µF–50 V, D | 0.798 | 3.318 | 4.16 | −2.1% |
| 1000 µF–6.3 V, E | 3.314 | 5.985 | 1.81 | −11.5% |
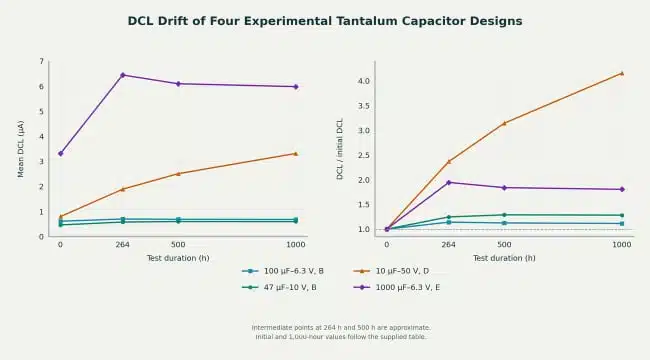
The results distinguish absolute leakage current from relative drift. The 1000 µF–6.3 V design has the highest absolute DCL at 1,000 hours, at 5.985 µA. The 10 µF–50 V design, however, shows the largest relative increase: its DCL rises from 0.798 µA to 3.318 µA, or 4.16 times its initial value.
The two B-case designs show smaller relative changes. DCL increases from 0.613 µA to 0.684 µA for the 100 µF–6.3 V design and from 0.465 µA to 0.597 µA for the 47 µF–10 V design.
Figure 1 adds information that the endpoint table alone cannot show. The 1000 µF–6.3 V design exhibits an early leakage-current increase followed by a modest decline, whereas the 10 µF–50 V design continues to increase through the final measurement.
The capacitance results underline the need to evaluate multiple indicators. The 10 µF–50 V design has the smallest reported capacitance loss, at −2.1%, but the largest relative DCL increase. Conversely, the 1000 µF–6.3 V design has the largest capacitance loss, at −11.5%, without the largest relative leakage-current drift. Capacitance stability and leakage-current stability are therefore not interchangeable measures in this dataset.
Turning Results into Targeted Process Corrections
The different leakage trajectories help identify where further investigation is needed. A design that continues to drift requires a different follow-up assessment from one showing an early change followed by stabilization.
For the high-voltage design, the development approach directs attention toward the relationship between interparticle neck structure and formation conditions. Variables for further investigation include electrolyte conditions, formation current and the voltage-rise profile. These are candidate process levers, not causes established by the endpoint data.
The experimental results should therefore feed back into the model and the next pilot lot. Structural measurements can help guide the investigation, while subsequent electrical testing determines whether the proposed correction improves stability.
Practical Value and Validation Limits
The main engineering contribution is a more structured way to choose the next experiment. Reference measurements establish a target, modeling narrows the process domain, SSC checks the resulting structural-mechanical response, and life testing evaluates electrical stability over time.
The supplied tables do not specify the full test conditions, sample distribution or acceptance limits. They therefore support a comparison of the reported experimental outcomes, but not a conclusion that any design has passed a particular qualification standard. Nor do they establish performance for the two H-case high-voltage designs, which are listed in the development program but absent from the supplied life-test table.
SSC should consequently be treated as a complementary diagnostic tool. Design-specific acceptance limits and reliability conclusions still require electrical measurements, appropriate sampling and life-test evidence.
Further reading
- Practical Value of Structural Diagnostics for Tantalum Capacitor Anodes
- From DCL to SSC: Bridging Electrical Symptoms and Structural Indicators in Tantalum Capacitors
- Methodology for Evaluating Stability of Tantalum Capacitor Anodes After Mechanical Testing
Source
This article is based on Vladimir Azbel’s technical article “From an Industrial Structural Reference to a New Tantalum Anode Design” and the accompanying tables and figure. The experimental results and development approach are attributed to the author; the discussion distinguishes reported observations from interpretations and validation requirements.
References
- Vladimir Azbel: From an Industrial Structural Reference to a New Tantalum Anode Design
- Azbel V. Structural Foundations of Reliability in Tantalum Capacitor Anodes. Zenodo. https://doi.org/10.5281/zenodo.18669845.
- Azbel V. Virtual Program for Calculating the Risk of Overheating in the Manufacture of the Anode of a Tantalum Capacitor. Zenodo. https://doi.org/10.5281/zenodo.19482661.
- Azbel V. Digital Structural Twin: From SSC to Deterministic Reliability Prediction. Zenodo. https://doi.org/10.5281/zenodo.20773830.
- Azbel V. Methodology for Evaluating Stability of Tantalum Capacitor Anodes After Mechanical Testing. EPCI https://passive-components.eu/methodology-for-evaluating-stability-of-tantalum-capacitor-anodes-after-mechanical-testing/