


This article, written by Vladimir Azbel, Ph.D., a semiconductor process reliability engineering consultant, and adapted and edited for passive-components.eu, rovides an overview of how structural diagnostics based on stress–strain curve analysis can turn tantalum capacitor anodes from a “black box” into a controllable, benchmarked system for reliability and production economics.
Tantalum capacitors are often chosen for their combination of high volumetric efficiency and reliability, especially in medical, aerospace, defence, and demanding industrial electronics. Miniaturization, higher formation voltages, and the push for higher CV powders mean that even small structural deviations in the anode can translate into latent defects, excessive drift, and catastrophic failures in the field. Structural diagnostics based on mechanical stress–strain curve (SSC) testing and digital/AI‑assisted analysis offer a way to bring these internal structures under systematic control.
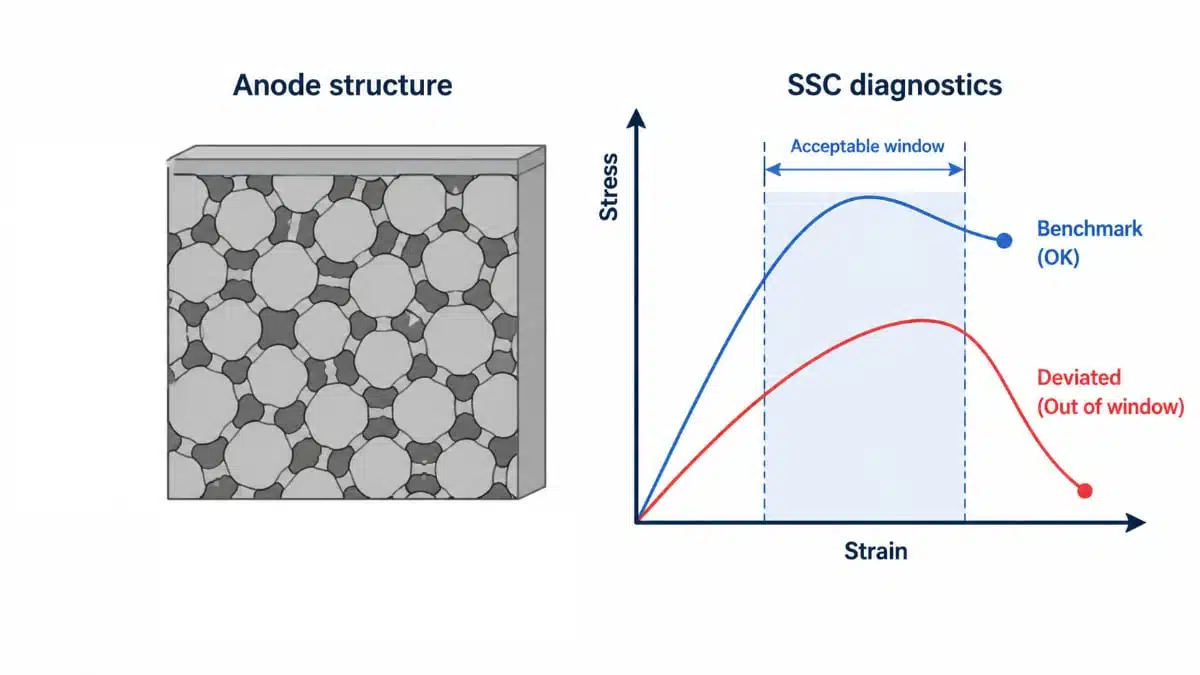
The structural diagnostics method shifts anode control from evaluating the final electrical result to performing an early structural audit. Standard electrical tests remain essential, but they mainly answer whether the finished capacitor meets requirements at a given moment. SSC analysis adds another layer: it shows whether the anode structure itself is close to a proven safe benchmark state and whether it can maintain DCL stability after forming, stress exposure, and long-term operation.
The essence of the method can be reduced to two main functions:
- Benchmarking — production control by comparing the current anode structure with a reference safe state at different stages: powder, pressing, sintering, forming, and the finished design.
- Mechanical Drift — evaluation of structural stability after controlled stress exposure, such as accelerated thermal aging, reverse bias, life test, or other reliability-relevant conditions. This reveals the hidden risk of future DCL degradation even when the initial wet test result is acceptable.
The economic meaning of the approach is that hidden structural risk can be detected before it appears as late DCL growth or failure. Therefore, the method helps not only to reject risky lots earlier but also to understand the direction of corrective action: powder, pressing, sintering, forming, internal stress, interface zone, or insufficient structural design margin.
Introduction: From Electrical Result to Structural Cause
Modern control of tantalum capacitors is based primarily on electrical parameters: capacitance, DCL, ESR, surge test, life test, and other qualification tests. These methods are necessary and remain the foundation of production control, but they mainly record the final result.
If DCL increases after testing, the electrical control shows the fact of degradation. However, the main engineering question is deeper: where did the cause originate — in the powder, pressing, sintering, forming, internal stresses, neck geometry, or degradation of the interface zone?
The proposed approach does not cancel electrical control and does not replace qualification tests. Its role is to supplement them with a structural audit of the anode. The method is based on standardized material-testing principles and interprets the result not as a subjective expert opinion, but as a measurable deviation of the anode structure from a benchmark state. This makes the approach clearer for engineers, quality specialists, reliability teams, and production managers.
In other words, the anode ceases to be a “black box.” Between the technological route and the final electrical result, a measurable structural layer appears: SSC parameters, benchmark deviation, mechanical drift, and an engineering interpretation of risk.
1. Production Control of the Anode by the Benchmark Principle
The first practical capability of the method is production control of the anode through comparison with a reference structural state. In meaning, this is close to ASTM-like material control, but with an important difference: the result is not reduced to “pass/fail.” Comparison with the benchmark shows which structural elements are responsible for the deviation: porosity, interparticle necks, internal stresses, or the interface zone.
The benchmark can be defined for different stages, depending on the task: powder, sintered pellet, formed anode, or a finished TC design that has already demonstrated stability and passed qualification. To clarify,
For the same material grade or powder grade, produced according to the same manufacturing recipe, preservation of SSC mechanical characteristics has a direct practical meaning: it indicates that the anode structure is being reproduced in a similar structural state. In this sense, SSC parameters serve not only as mechanical values, but also as structural fingerprints of the porous tantalum skeleton. If these fingerprints remain within the benchmark window, the manufacturer can reasonably assume structural similarity of the anode lot at an engineering-control level.
The benchmark is not a technological recipe. It is a measured structural state of a reliable product or a control sample.
Therefore, the production question changes. It is not enough to ask only: “Did the anode pass the electrical test?” The more important question becomes: “Was a structure obtained that is close to the reliable benchmark anode and has a low risk of DCL degradation?”
For this assessment, parameters of the stress–strain curve are used. They serve as digital indicators of the porous structure: porosity, skeleton connectivity, interparticle neck quality, internal stresses, and the structure’s ability to accommodate deformation.
For the same material grade or powder grade, produced according to the same manufacturing recipe, preservation of SSC mechanical characteristics has a direct practical meaning: it indicates that the anode structure is being reproduced in a similar structural state. In this sense, SSC parameters serve not only as mechanical values, but also as structural fingerprints of the porous tantalum skeleton. If these fingerprints remain within the benchmark window, the manufacturer can reasonably assume structural similarity of the anode lot at an engineering-control level.
| Controlled item | What SSC analysis shows | What this gives production |
|---|---|---|
| Powder | Not only chemical composition, COA, and CV/µg, but also the structure that the powder forms in a control pellet. | A more technical dialogue with the powder supplier and early screening of lots with an unfavorable structural tendency. |
| Pressing and sintering | Deviation of skeleton connectivity, neck quality, and mechanical stability from the benchmark. | The problem is detected before expensive subsequent operations; correction is directed toward pressing density, sintering conditions, or powder selection. |
| Forming | Increase in internal stresses, change in plastic accommodation, and possible deterioration of the interface zone. | It becomes possible to understand whether the forming regime creates a hidden risk of DCL degradation. |
| Lot stability | Drift of SSC parameters relative to the benchmark over time. | A tool appears for trend analysis and process-stability control. |
| New design | Structural reliability margin before long qualification tests. | Obviously, risky miniaturization or design-change options can be excluded earlier. |
The main production advantage is early risk detection. If the problem is discovered only at the final electrical test, the resources for the entire technological route have already been spent. If the structural deviation is visible after sintering or on a powder control sample, the lot can be stopped earlier, the cause can be found faster, and production losses can be reduced.
Engineering Language of the Method: From Parameter Deviation to Corrective Action
For the method to be understood not only as a scientific interpretation, but also as a production tool, each type of deviation should be connected with a possible direction for corrective action. In this sense, SSC does not simply state that “quality has deteriorated.” It shows which structural parameter has shifted and where the engineer should look for the cause.
| Diagnostic sign | Possible structural meaning | Most likely direction for verification |
|---|---|---|
| E below the benchmark | Insufficient connectivity of the porous tantalum skeleton or increased structural looseness. | Pressing density, sintering regime, powder properties. |
| Aᵧ above the benchmark or noticeably changes after exposure | Increase in local defectiveness/stress state of Ta necks or a change in the ability of the structure to provide plastic accommodation. | Interparticle neck quality, sintering, mechanical overload of the structure, and the influence of forming. |
| ΔK₂ outside the benchmark window | Change in the nonlinear deformation region associated with the redistribution of internal stresses or damage to weak structural zones. | Sintering regime, neck distribution, internal stresses, and interface zone. |
| Increase in MDI after stress exposure | The structure has insufficient stability; after exposure, it does not return to the benchmark state and retains a “mechanical memory” of aging. | Verification of sintering and forming regimes, interface‑zone stability, and the thermal/electrical stress route. |
2. Evaluation of Structural Stability after Stress Exposure
The second practical capability of the method is the evaluation of anode structural stability after controlled exposure. Logically, this approach is close to testing heat-resistant and thermally stable materials, where mechanical characteristics are compared before and after thermal exposure that simulates or accelerates operating conditions.
For a TC anode, this is especially important because the key reliability parameter is DCL stability. It is largely determined by the stability of the amorphous Ta₂O₅ film and the state of the Ta / interface-zone / Ta₂O₅ system. The anode may have an acceptable initial DCL, but after reverse bias, thermal cycling, humidity, long-term storage, or life test, internal stresses and irreversible structural changes may accumulate.
The method compares the structural state of the anode according to a simple logic:
before exposure → after exposure → benchmark evaluation of mechanical drift
In practice, such a test can be performed on a small sample, for example, 5–10 anodes from a lot that has already passed the wet test. This makes it possible to assess not only the initial DCL value, but also the hidden structural resistance of the lot to future DCL degradation. If, after accelerated exposure, SSC parameters change only slightly and remain close to the benchmark, the lot has a higher structural reliability margin. If pronounced mechanical drift is observed, this indicates an aging risk even when wet test results are acceptable.
As an accelerating condition, thermal exposure such as 450 °C may be used when it is justified by the research task and is consistent with previous qualification or comparative experience. The purpose of such exposure is not to reproduce the real service temperature, but to reveal the tendency of the structure toward irreversible change.
Evaluation uses changes in stress–strain parameters: ΔAᵧ, ΔK₂, ΔE, changes in the plastic region, and MDI — Mechanical Drift Index. These parameters reflect mechanical drift, that is, the structural “memory” of the anode after testing.
It is important to emphasize that Mechanical Drift should not be presented as a replacement for life test or as a direct calculator of the future DCL value. Its strength is distinct: it shows how far the structure deviates from the safe benchmark state after stress exposure. This gives the engineer an early indication of the risk of hidden DCL instability.
3. Structural Analysis of Failure Causes after Testing
The third practical capability of the method is analysis of failure causes in TCs after different stress regimes: reverse bias, life test, thermal cycling, humidity, elevated temperature, or other reliability conditions.
Conventional electrical control shows the result: DCL growth, parameter shift, or failure. However, it does not always explain which structural cause led to that result. Using SSC parameters makes it possible to supplement electrical information with a structural picture of anode degradation.
After testing, the anode can be analyzed by changes in stress–strain curve parameters. This helps determine whether failure or DCL growth is associated with the accumulation of internal stresses, weakening of interparticle necks, reduction of plastic accommodation, interface-zone defectiveness, or irreversible change in the Ta / interface-zone / Ta₂O₅ system.
The practical value of such analysis is that the manufacturer receives not only an electrical conclusion such as:
“DCL increased after testing.”
A more useful engineering formulation is different:
“DCL growth is accompanied by a specific structural change in the anode, indicating the probable direction of the degradation cause.”
This reporting format is understandable for the manufacturer because it shows the direction of corrective actions: powder, pressing, sintering, forming, internal stresses, interface-zone, or anode design margin. Therefore, the method turns failure analysis from a simple description of failure into a tool for cause identification and reliability improvement in TCs.
4. Improved Interaction with Suppliers and High-Reliability Customers
A separate practical value of the method is that it changes the language of discussion between the capacitor manufacturer and the powder supplier. Usually, the dialogue is built around COA, chemistry, impurity levels, CV/g, and standard powder specifications. These parameters are necessary, but they do not always show what structure the powder forms in a real anode after pressing and sintering.
SSC benchmarking makes it possible to discuss not only the powder certificate, but also the final structural result: skeleton connectivity, interparticle neck quality, mechanical drift, and closeness to a reliable benchmark. This shifts the relationship with the supplier from a formal discussion of numbers to technical partnership and structural transparency.
For high-reliability applications — medical, aerospace, and military — such transparency is especially important. In these areas, the cost of late failure is critically high, while conventional electrical testing does not always reveal hidden structural instability. Therefore, structural diagnostics should be positioned here not simply as an “improvement,” but as an additional risk-management tool that provides a reliability guarantee invisible to standard electrical tests.
5. Economic Effect
The method gives an economic effect not because it replaces standard tests, but because it helps make engineering decisions earlier and more accurately. It allows structural risk to be seen before the product has passed through all expensive manufacturing stages or before failure appears during late qualification.
In practice, this can provide:
- Less late-stage scrap, because structural risk is visible before final control.
- Lower cost of failure-cause analysis, because the method shows the direction of analysis: powder, pressing, sintering, forming, internal stresses, interface-zone, or anode design.
- Faster introduction of new powders and designs, because they can be compared with the benchmark before long qualification testing.
- More constructive interaction with the powder supplier, because the discussion includes not only COA, CV/g, and chemistry, but also the structure that the powder actually forms in the anode.
- Lower risk for high-reliability applications — medical, aerospace, and military — where late failure is especially costly.
- Faster corrective actions, because deviations in SSC parameters are linked not to the general phrase “quality deteriorated,” but to a specific technological direction for verification.
Summary and Conclusion
Short Positioning of the Method
The method is not a new technological recipe and does not replace electrical testing. Its practical role is different: it turns the anode from a “black box” into a controlled structural system.
Electrical control answers the question:
“Does the capacitor meet requirements now?”
Structural diagnostics answers a different question:
“Does the anode have a structure capable of preserving reliability after forming, stress exposure, and long-term operation?”
This is the practical value of the method for reliability and production economics in tantalum capacitors.
The structural diagnostics method does not replace electrical control; it supplements it with predictive capability, turning failure-cause analysis from guesswork into a precise engineering discipline.
References and further reading
For readers who would like to understand the physical basis and the complete methodological framework of this approach, the two related parts are available here:
- Part I — Structural Interpretation of Reliability in Tantalum Capacitor Anodes https://doi.org/10.5281/zenodo.18669845
- Part II — From Structural Diagnostics to Digital Structural Twin https://doi.org/10.5281/zenodo.20773830
and further posts published on Passive Components Blog:
- Application of the Stress–Strain Curve Method for Structural Control of Tantalum Capacitor Anodes
- Mechanical SSC Testing as a Structural Diagnostic Tool for Tantalum Capacitor Anodes
- Using Stress–Strain Curves to Diagnose Tantalum Powders for Capacitors
- Tantalum Capacitor Anodes Degradation under Reverse Bias: Mechanical Drift as Structural Indicator
- AI-Assisted Structural Diagnostics and Physics-Based Reliability Interpretation of Tantalum Capacitor Anodes
- Digital Twin of a Tantalum Capacitor Anode: From Powder to Formation
- Defining the Structural DNA of Tantalum Capacitor Anodes
- Acceleration Factors for Reliability Assessment of Polymer Tantalum Capacitors
- Sintering and Electrical Properties of Tantalum Anodes for Capacitor Applications
- Miniaturization of Tantalum Capacitors: Structural Limit Under Constant Rating