









Connector raw material costs increased 20.9% year over year in the second quarter of 2026, according to Ronald E. Bishop of Bishop & Associates in an analysis published by TTI MarketEYE.
Copper/brass and thermoplastics were the main contributors to the increase, while gold remained significantly more expensive than a year earlier despite falling from its first-quarter level.
The findings highlight continuing cost pressure across connector manufacturing. However, the reported material-cost increase should not be interpreted as an equivalent rise in finished connector prices: the impact depends on each product’s material content, manufacturing costs and commercial pricing arrangements.
Copper/Brass Accounts for More Than Half of the Increase
Bishop’s model tracks gold, copper/brass, steel and thermoplastics using a representative material-usage weighting. Copper/brass carries the largest weighting at 46.7%, followed by thermoplastics at 33.3%, gold at 13.3% and steel at 6.7%.
| Material | Q2 2026 year-over-year change | Material-usage weighting | Weighted contribution |
|---|---|---|---|
| Gold | +34.1% | 13.3% | +4.5 percentage points |
| Copper/brass | +24.5% | 46.7% | +11.4 percentage points |
| Steel | +12.9% | 6.7% | +0.9 percentage points |
| Thermoplastics | +12.1% | 33.3% | +4.0 percentage points |
| Total | — | 100.0% | +20.9% |
Figures are reproduced from the source; individual rounded contributions may not sum exactly to the reported total.
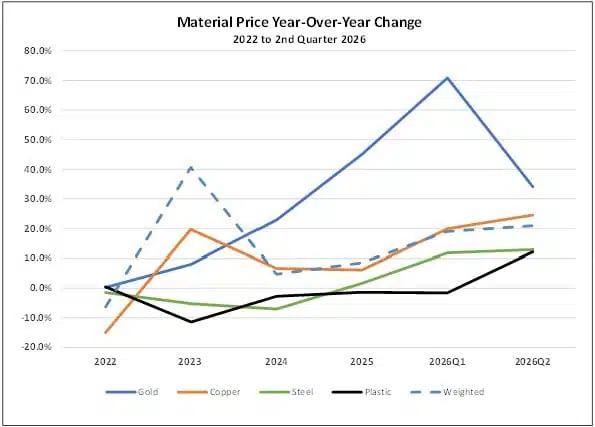
Copper/brass contributed 11.4 percentage points—more than half of the overall increase. This illustrates why the largest percentage price movement does not necessarily create the largest cost impact. Gold rose faster year over year, but copper/brass has a substantially greater weighting in the model.
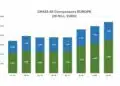
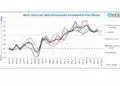
The weighted annual increase accelerated from 18.5% in the first quarter to 20.9% in the second quarter.
Gold Eases Sequentially but Remains Above Year-Earlier Levels
Gold prices declined 11.0% quarter over quarter in Bishop’s second-quarter comparison. Nevertheless, they remained 34.1% above the corresponding period of 2025.
This distinction matters for purchasing and budgeting. A sequential decline indicates relief compared with the immediately preceding quarter, but it does not mean that costs have returned to their earlier baseline.
The analysis reports that some connector manufacturers have responded through selective product price increases, while others use market-linked pricing contracts to pass changes in gold costs through to customers.
Thermoplastics Add Pressure Beyond Metal Prices
Thermoplastics increased 12.1% year over year and 11.3% quarter over quarter. Their one-third weighting in the model makes housing-material costs an important contributor alongside conductive metals and contact finishes.
Bishop also identifies energy as a broader manufacturing-cost pressure. Beyond its relationship with polymer feedstocks, energy affects production equipment, plant operation and transportation.
The resulting exposure extends beyond the purchase price of metals: connector suppliers can face simultaneous changes in housing materials, processing costs and logistics.
Quarterly Figures Require Careful Interpretation
The source reports two different quarter-over-quarter measures for Q2 2026:
- A 2.5% unweighted average change across the four tracked material categories.
- A 4.6% increase after applying the model’s material-usage weightings.
These are different measures rather than interchangeable descriptions of the same result. Thermoplastics and copper/brass increased during the quarter and carry relatively high weightings, outweighing the effect of lower gold prices.
For the year-to-date comparison, the source reports a 19.7% weighted increase. That figure should also remain separate from the 20.9% second-quarter year-over-year result because the comparison periods differ.
What the Findings Mean for Connector Buyers
The most useful interpretation is exposure, rather than a universal connector-price forecast. A material-cost model provides a market indicator, but it does not establish the cost change for every connector family.
For procurement teams, the findings suggest several questions to address when evaluating supplier quotations:
- Which material categories are driving the proposed adjustment?
- Does the quotation reflect a specific product’s material content or a broader commodity index?
- What baseline, averaging period and adjustment frequency apply?
- Are commodity-linked surcharges separated from processing, logistics and other charges?
- Can the pricing mechanism move downward as well as upward when the relevant material index falls?
Separating these elements helps distinguish a documented material-cost adjustment from a general increase in the finished component price.
Material Substitution Is Not a Like-for-Like Cost Reduction
Bishop describes manufacturers evaluating alternatives such as aluminum or copper-clad aluminum in price-sensitive applications, alongside contact-finish options including palladium-nickel with a gold flash, tin and silver.
These approaches should be understood as application-dependent engineering changes, not universally interchangeable replacements. Any proposed substitution needs to retain the electrical, mechanical and environmental performance required by the connector specification.
The same relationship between material choice and component function extends into passive components. The role of electrode and termination materials in passive components explains why a commodity’s significance depends on where and how it is used—not simply on its market price.
Implications for the Wider Electronics Supply Chain
The connector figures provide useful context for electronics purchasing, but they are not a price index for capacitors, resistors or inductors. Those technologies use different combinations of metals, ceramics, polymers and processed materials.
For example, copper also enters the passive-component supply chain through MLCC termination materials. However, connector usage weightings cannot be transferred directly to an MLCC or resistor cost model.
The broader takeaway is that commodity movements need to be interpreted through the material structure of each component technology. Understanding that structure makes market updates more useful for both supplier discussions and product-cost planning.
Further reading
- How Metal Prices Are Driving Passive Component Price Hikes
- Dielectric Raw Materials Supply Chain Overview
- Copper Price Increase Impacts MLCC Supply Chain
Source
This article is based on Ronald E. Bishop’s market analysis, “Raw Material Costs Increased 20.9% Year Over Year in 2Q26,” published by TTI MarketEYE on October 5, 2026. The original is an industry market commentary, not a manufacturer product press release. Reported figures reflect the source’s material-cost model; procurement implications and comparisons with passive components provide additional editorial context.
References
- TTI MarketEYE: Raw Material Costs Increased 20.9% Year Over Year in 2Q26
- Passive Components Blog: Passive Components Electrodes and Terminations
- Passive Components Blog: How Metal Prices Are Driving Passive Component Price Hikes
- Passive Components Blog: Dielectric Raw Materials Supply Chain Overview
- Passive Components Blog: Copper Price Increase Impacts MLCC Supply Chain