


Paumanok Publications, Inc. has tracked the price and availability of specific ceramics and metals consumed as dielectrics and resistive elements and published its latest report article on TTI Market Eye blog. The post includes analysis of the passive components raw materials supply chain, and price fluctuations related to recent supply disruptions caused by the COVID-19 pandemic.
We noted in April 2020 that movements in the component markets were responding to fears that raw materials – including feedstocks and ores – would impact the supply chain for advanced electronic materials.
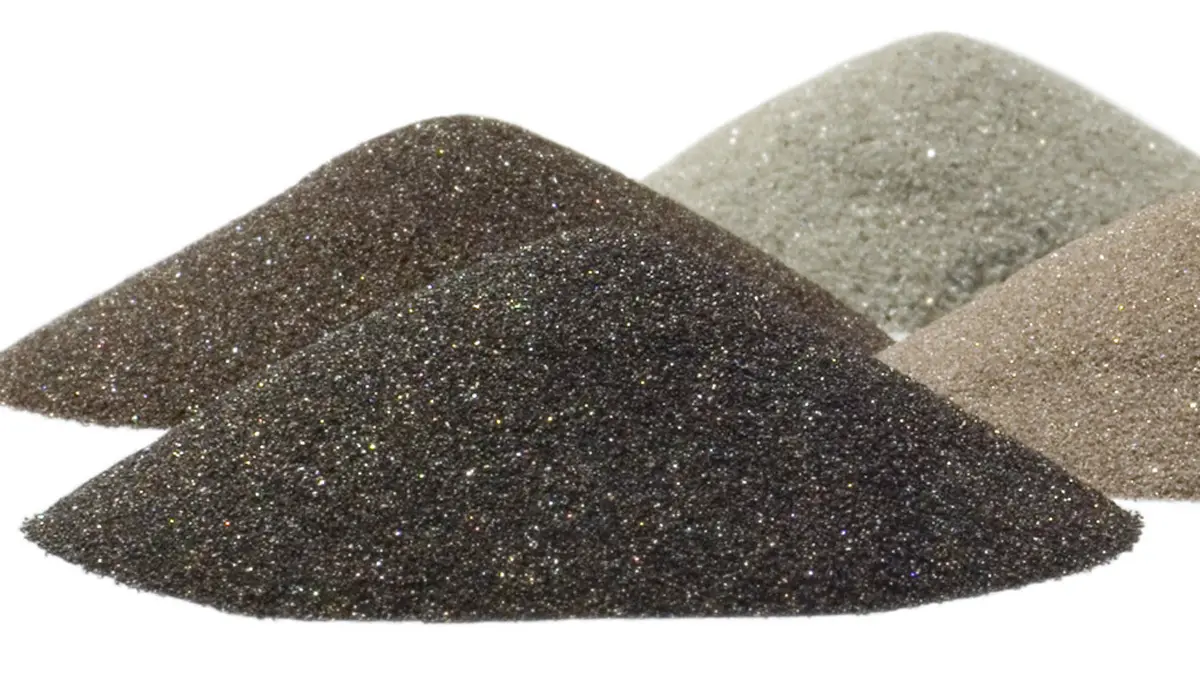
Passive electronic components are raw-materials intensive. The materials consumed mass production of surface mount passive components usually come in the form of engineered powders and pastes, which make up the largest “variable cost” associated with producing capacitors and resistors.
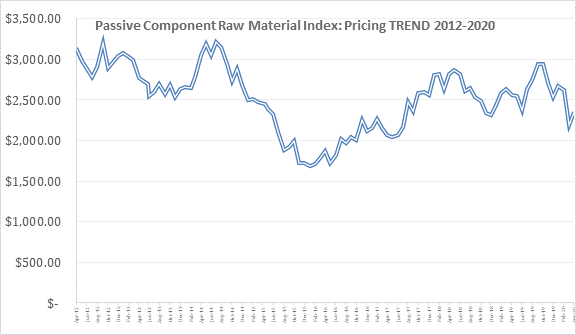
This is why Paumanok Publications, Inc. has tracked the price and availability of specific ceramics and metals consumed as dielectrics and resistive elements for the past 30 years. The chart below shows the long-term trend in the costs to produce passive components, with the more recent increase in production costs followed by a quick and significant downturn.
Figure 1: Passive Component Raw Material Index: Pricing Trend 2012-2020
How Materials Impact Passive Component Production Costs
Raw materials are the most expensive variable cost associated with production of passive electronic components. Any fluctuation in price or availability for these key feedstocks can have a negative impact on the profit margins of passive component manufacturers.
As Figure 1 (above) illustrates, raw material prices for passive components have been in steady decline since 2019, lost significant value in February and March 2020, but then began to recover in April 2020.
The “Big Data” set in Figure 1 illustrates how the market must correct by 30 percent when the index reaches a point above $3,000. However, it is equally important to note that as this movement is directly related to electronics and the high-tech economy, this index shows just how low the market can go.
When it comes to materials, the true doldrums coincided with the long period following the stimulus of 2011 when the electronic supply chain was trapped in a no-value-growth transitional period, punctuated only by the manipulation of currencies.
The index shown in Figure 1 is comprised of the following materials; each subset forms the ingredients for passive components, or the majority of material on the PCB that provides a function (other than plastics and silicon).
Nickel – The primary electrode material consumed in high-capacitance multilayered ceramic chip capacitors (MLCC). Fluctuations in the price of nickel are primarily the result of competition with the steel industry for this metal, where it is used as a hardener.
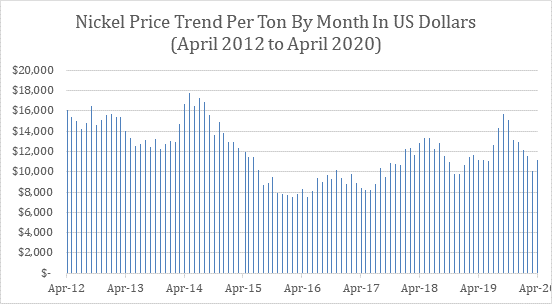
In turn, the nickel supply important for the production of X5R, Y5V and X7R MLCCs, the capacitors of choice for smartphones, tablets and TV sets. As the chart below shows, the price of nickel went above $15,000 a ton in September 2019, but has since plunged to $10,080 a ton by March 2020 – a 33 percent drop, indicative of the rapid nature of downward market shifts.
What is encouraging is that nickel prices started to recover in April, suggesting a clear turnaround in Chinese production. Nickel pricing fluctuates with the health of the Chinese economy as it is primarily consumed in steel, and steel is in great demand in China.
These price fluctuations from other external sources also impact the costs to produce high-capacitance MLCCs where nickel is used as the electrode. The reader should note that the continued weakness of the price of nickel is, in fact, an excellent litmus test for the health of the global economy. Once again, this material is at a low point but it has previously gone much lower in price in 2015 and 2016 when component markets struggled.
Figure 2: Nickel Price Trend: 96 Months of Data (April 2012-April 2020)
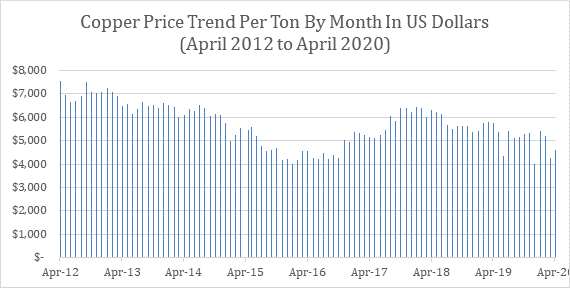
Copper – MLCC production also consumes copper engineered powders, but as the termination material consumed in conjunction with the nickel-type electrode. Therefore, copper and nickel are an important type of base-metal duo. Copper is used in some MLCC electrode systems because, unlike its counterpart nickel, it is non-magnetic.
In April 2020, copper prices reached a low point comparable to pricing in April 2016, one of the lowest price points in the past 96 months. Copper is another of Paumanok’s key indicators for the larger global economy. The double pressure of trade tensions between the U.S. and China and the global COVID-19 pandemic have created tremendous month-to-month volatility in copper prices, but pricing remains relatively stable.
Figure 3: Copper Price Trend, 96 Months of Data (April 2012 – April 2020)
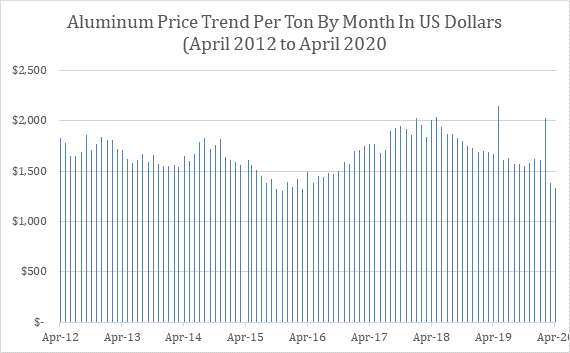
Aluminum – Etched anode and cathode foils are consumed as the dielectric layers of aluminum electrolytic capacitors the world over. Aluminum comes from bauxite, a mined material whose price is easily calculated. Aluminum is abundant in the Earth’s crust and its price has been historically stable.
Aluminum electrolytic capacitors are important components consumed in power supplies, television sets, computers and power electronics, including renewable energy systems. The price of aluminum was turbulent during the trade tensions between the U.S. and China, but has since reacted toward impacts from the pandemic in 2020.
Because the supply chain is in fact a complex web of relationships, the real threat of “pandemic” and “forced embargo/closed borders” is at the raw material level. If ores and feedstocks cannot be received, the process to produce components cannot begin. So is the case with bauxite: any impact on Brazilian output would be a significant challenge to the industry, and the same applies to products like tantalum from Central Africa.
As the following chart illustrates, aluminum prices have fallen to the lowest levels in 96 months, similar in price to the levels seen in April 2015 and 2016 (when electronics ROI was terrible). However, in April 2020, following a rolling pandemic, the impact was bad, but not as bad as expected.
Our models still show that the coming months leading into July and August of 2020 will be a tell because of HVAC consumption and an expected downturn in the automotive sector.
Figure 4: Aluminum Price Trend, 96 Months of Data (April 2012 – April 2020)
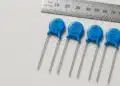
Zinc – Used as an additive in ceramic chip capacitors and as the primary ingredient in the production of metal oxide varistors (which are consumed for circuit protection components in all known AC-line voltage equipment), zinc has declined steadily in price since October 2019 and is approaching a 96-month low point.
Zinc prices came down significantly in April, comparable with April 2015 and April 2016 prices.
Figure 5: Zinc Price Trend, 96 Months of Data (April 2012 – April 2020)

Palladium – A platinum group metal that is mined in South Africa and Russia, among other locations, consumed primarily for auto-catalysts, but also for jewelry. It is the primary electrode material in precious-metal-based MLCCs, which are in turn used in high-reliability, high-temperature and high-voltage product markets globally.
Historically, palladium has proven a difficult raw material partner for the MLCC supply chain because of its price volatility, which is compounded by its status as a significant commodity metal subject to outside speculation on price.
The price of palladium became volatile in 2019 and reached unheard-of levels in the beginning of 2020. However, the price has relaxed in April while remaining well above the norm.
Figure 6: Palladium Price Trend, 96 Months of Data (April 2012 – April 2020)

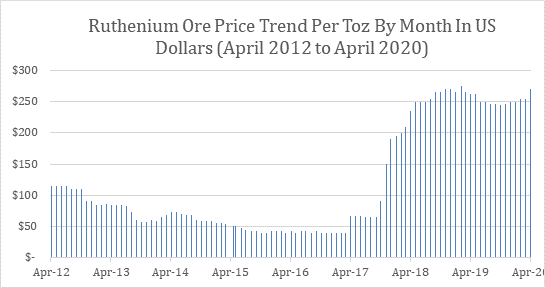
Ruthenium – A precious metal similar to palladium, but primarily consumed in all thick film chip resistors and resistor networks produced worldwide. The price of ruthenium skyrocketed in 2018 and remained elevated in 2019, with its price up 275 percent year-over-year. The ruthenium price has remained largely unchanged since 2018.
Readers should note that the thick film chip resistor business concerns us most, and offers the greatest risk factor in all of electronics. The product is overlooked and its nature is not understood by most in the supply chain; however, it accounts for 33 percent of the units consumed in any circuit board. The number of vendors is large, but those with major economies of scale are limited to Yageo, Panasonic, KOA and Rohm.
Figure 7: Ruthenium Price Trend, 96 Months of Data (April 2012 – April 2020)
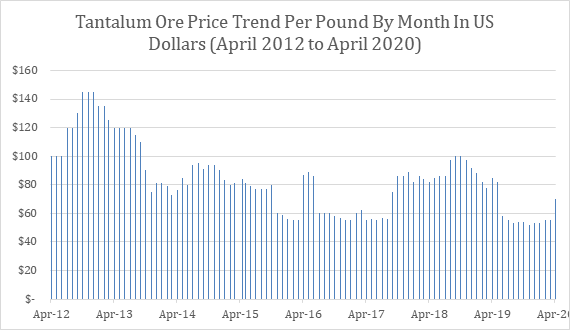
Tantalite – The majority of tantalite metal used in the production of tantalum capacitors comes from Central Africa. Other known tantalite resources are located in Australia, Brazil and Canada. Tantalite’s primary use is as a capacitor-grade tantalum metal powder for consumption in capacitor anodes. Tantalum capacitors are consumed in communications networking equipment, smartphones, automotive, medical and defense electronics.
Tantalite and tantalum ores have demonstrated volatile pricing in the past, but have remained relatively stable in price during the current market shortages. The lessons learned from the tantalum supply chain have been, and will continue to be, valuable as OEM brands insist on transparency on all materials supply chains.
In April 2020, price increase began to affect tantalum ore as concerns increased that the pandemic would impact Africa, putting a strain on tantalum, palladium, ruthenium and silver.
Figure 8: Tantalum Ore Price Trend, 96 Months of Data (April 2012 – April 2020)
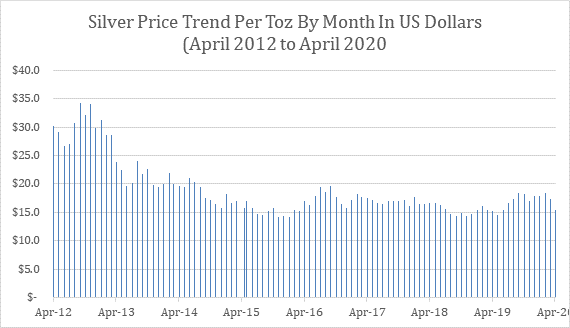
Silver – Consumed as a termination material for many electronic components, but primarily for MLCCs that employ precious metal electrodes. These components with silver terminations are, in turn, consumed in high-voltage, high-temperature and high-reliability applications.
Silver has remained relatively stable since 2013 and has moved very little in price compared to other materials in this category.
Figure 9: Silver Price Trend, 96 Months of Data (April 2012 – April 2020)
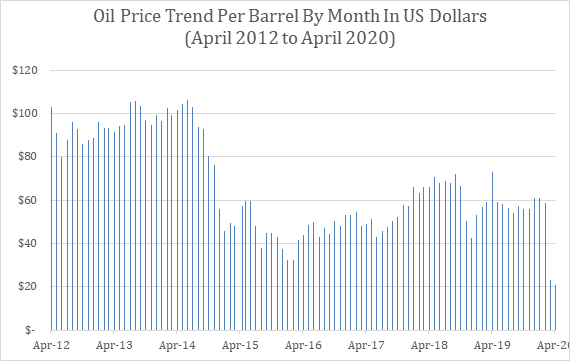
Oil – Crude oil pricing is of interest because it sets the stage for so many other commodities, but is also included here because any wild swings in the oil supply would also impact the plastics industry, and in turn would impact the film dielectric capacitor segment. Film capacitors are consumed in both DC and AC circuits and are primarily associated with power-related equipment, lighting and home appliances.
Crude oil futures prices went negative in April and have now settled at about $21 a barrel, the lowest point in the past 96 months.
Figure 10: Oil Price Trend, 96 Months of Data (April 2012 – April 2020)
Overall Price Index: Summary and Conclusions
Many key raw materials included in this index experienced price reductions in March and April 2020 in response to the pandemic. Many of these commodities declined in price to the lowest points seen over the past 96 months covered in the data set. Nickel, copper, aluminum and zinc materials all realized low points in price in March and April. Palladium saw great fluctuation and remains elevated. Tantalum prices and ruthenium prices began to increase, while oil prices set new lows.
Overall, however, the price adjustment for electronics seems similar to a return of the price points in April of 2015 and 2016, when the electronics industry was in slow growth mode. We do not yet see a great drop in consumption and will probably not see that until July 2020.
As of April, the following could be determined:
- Base metals –aluminum, copper, nickel and zinc – were near their lowest levels over the 96 month data set; however, they were not as low as they were in April 2015 through April 2016, when the electronic components business was in the ROI doldrums.
- Precious and exotic metals, however, were showing the opposite impact. Palladium prices were at an all-time high: even though they had come back down in April they still represent very high prices in historical context. Tantalum, which is usually a volatile metal pricewise, has remained stable but had begun reacting to fears that the pandemic might curtail shipments in Africa. Ruthenium prices have also moved upward in April 2020, and represent the part of the market that has exhibited the most volatility in materials pricing and in facts represents the largest threat to the high-tech economy going forward.
- Proximity to production sites impacted by the pandemic (China and Taiwan almost exclusively at this point) and volatile materials supply suggests that chip resistors are the largest red flag in the grouping right now.