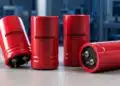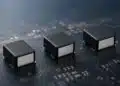


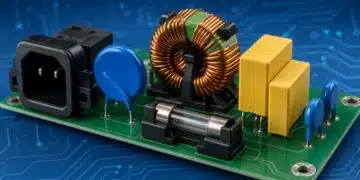


DC-link capacitors are an essential stage in power conversion for many applications, including three-phase pulse width modulation (PWM) inverters, photovoltaic and wind power inverters, industrial motor drives, automotive onboard chargers and inverters and medical equipment power supplies.
When to and why use a DC-link capacitor
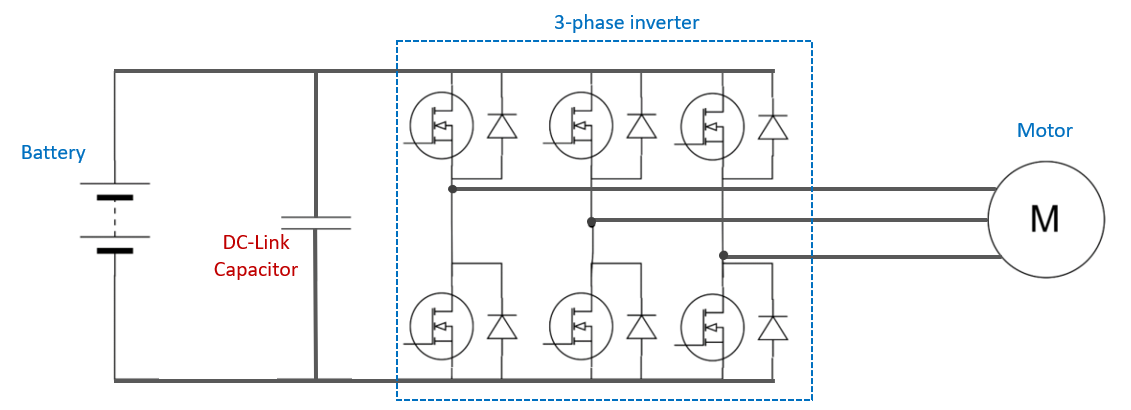
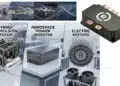
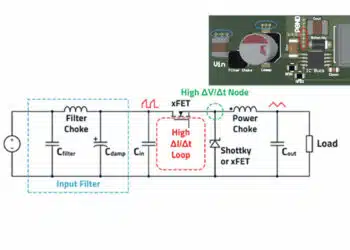
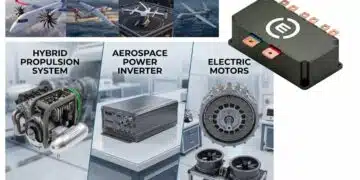
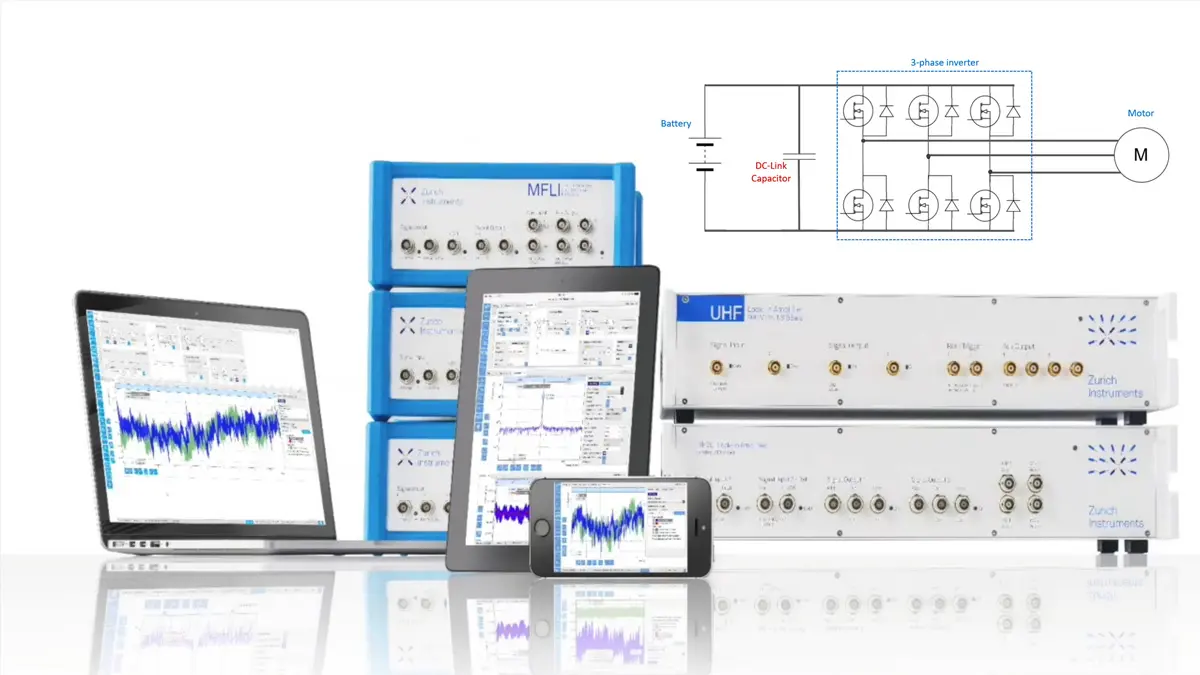
Where and why is a DC-link capacitor used? Figure 1 shows a drive system for an automotive battery electric vehicle (BEV). The system includes a rechargeable bank of batteries to store energy for the drive system, a three-phase inverter and an electric motor to provide traction. The battery output voltage can be as high as 800 V DC.
This application, and those mentioned earlier, are DC-to-AC designs. They control the power delivery to the load using power transistors (IGBTs or power MOSFETs) that switch high levels of voltage and current at kilohertz frequencies. Switching topologies are inherently efficient but generate a high level of electrical noise and voltage spikes during switch turn-off. They also impose heavy transient current demands on the system DC supply.
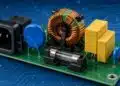
The DC-link capacitor is located between the DC power source and the switching circuit. Its purpose is to provide a more stable DC voltage, minimizing voltage dips as the inverter sporadically demands heavy current.
The importance of accurate ESL/ESR measurement
The electrical response of an “ideal” capacitor is purely capacitive, but a real-world device also has parasitic inductance and resistance.
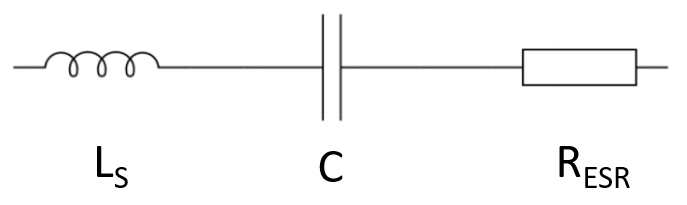
Figure 2 shows an electrical model of a physical device. In addition to the capacitance, it includes an equivalent series resistance (ESR) and an equivalent series inductance (ESL), shown as RESR and Ls respectively. RESR is a lumped parameter representation of the resistive and dielectric losses of the capacitor, while Ls represents the inductance of the capacitor leads or terminals, as well as the construction of the capacitor itself.
The ESL and ESR of the DC-link capacitor and its connectors have a significant influence on the overall design of an inverter application such as discussed above. Energy stored in the parasitic inductance can cause voltage overshoot when the motor drive transistor (IGBT or MOSFET) is switched off. And the ESR causes power dissipation and consequently generates heat, which is always an issue in a cramped, high-temperature automotive environment.
There are other complications, too. The impedance of the capacitive element decreases with increasing frequency; the ESL, on the other hand, increases with frequency. At a certain frequency — the self-resonance frequency (SRF) — the two quantities cancel, and the capacitor has zero effective impedance. At frequencies above the self-resonance frequency, the ESL dominates, and the capacitor impedance begins to increase.
Improvements in capacitor technology have resulted in devices with ESL values of a few nH, and ESR values of less than 1 mΩ. An accurate measurement of the ESL and ESR must be performed to confirm the datasheet values and ensure that the part will meet the requirements of the application with an adequate safety margin. As the capacitance, ESL and ESR vary as a function of frequency, the measurement should take place over a wide frequency range and not just at a standard set of fixed frequencies.
Getting started with ESL and ESR measurement
An LCR meter and an impedance analyzer are the two most common pieces of test equipment for characterizing the performance of a DC-link capacitor.
Both instruments determine impedance parameters such as capacitance, inductance and resistance by measuring the phase-sensitive voltage-to-current ratio. This ratio gives the fundamental impedance values: the absolute impedance and phase, plus the real and imaginary part of the impedance.
Parameters such as capacitance, inductance and resistance can be derived by applying a user-defined equivalent-circuit model to the fundamental impedance values; additional parameters including Q factor, dissipation and conductance can also be derived.
An LCR meter measures parameters at one or more fixed frequencies, requiring an additional interpolation step to produce the impedance parameters.
An impedance analyzer such as the Zurich Instruments MFIA Impedance Analyzer is a more powerful solution. It maintains the full LCR functionality while being able to sweep the frequency and graphically display the acquired impedance parameters. In addition, the MFIA can measure in the time domain and visualize the self-resonance in the frequency domain.
The MFIA can perform impedance measurements in the frequency range from 1 mHz to 500 kHz, or to 5 MHz. The analyzer has a basic accuracy of 0.05% and operates over a measurement range spanning from 1 mΩ to 1 TΩ, with high repeatability and low drift over temperature.
The MFIA includes LabOne®, Zurich Instruments’ platform-independent instrument control software. The browser-based user interface comes with a comprehensive toolset for time- and frequency-domain analysis.
Specialized LabOne features for the MFIA include the Impedance Analyzer tab, which simplifies key set-up functions, stores key parameters for quick recall, and allows for quick and clearly defined measurements. It also features the Compensation Advisor, which guides the user step-by-step through the elimination of any adverse effects caused by their test fixture or cabling in order to achieve reliable and accurate measurement results. Other functionalities of LabOne include the Sweeper, which enables the user to sweep instrument parameters over a defined frequency range with a freely adjustable number of scan steps, either linearly or logarithmically.
Overview of the ESR/ESL measurement procedure
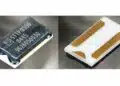
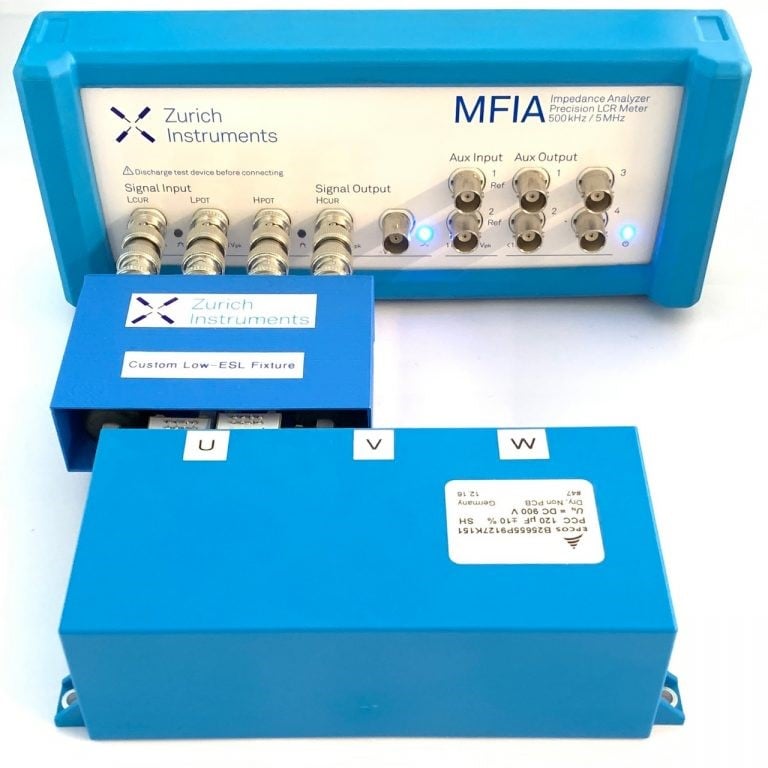
The MFIA and LabOne can easily measure the ESL and ESR of a DC-link capacitor. Figure 3 shows the test setup used with a TDK capacitor with nominal capacitance of 120 µF, ESR of 0.8 mΩ and ESL of 15 nH.
The custom low-ESL test fixture between the MFIA and the capacitor features flexible connectors to accommodate the vertical offset of the DC-link busbar connectors, which match the IGBT module in the application.
The measurement procedure is as follows:
Perform a baseline measurement
The test setup must be able to measure the low ESL and ESR of the DC-link capacitor with high accuracy and repeatability. For accurate impedance measurements, it is necessary to first run a compensation routine so that the impedance of the fixture can be neglected in the actual measured data.
The LabOne Compensation Advisor runs a load-short measurement from 1 kHz to 5 MHz. This compensation routine defines the location of the measurement plane to be at the connectors of the test fixture.
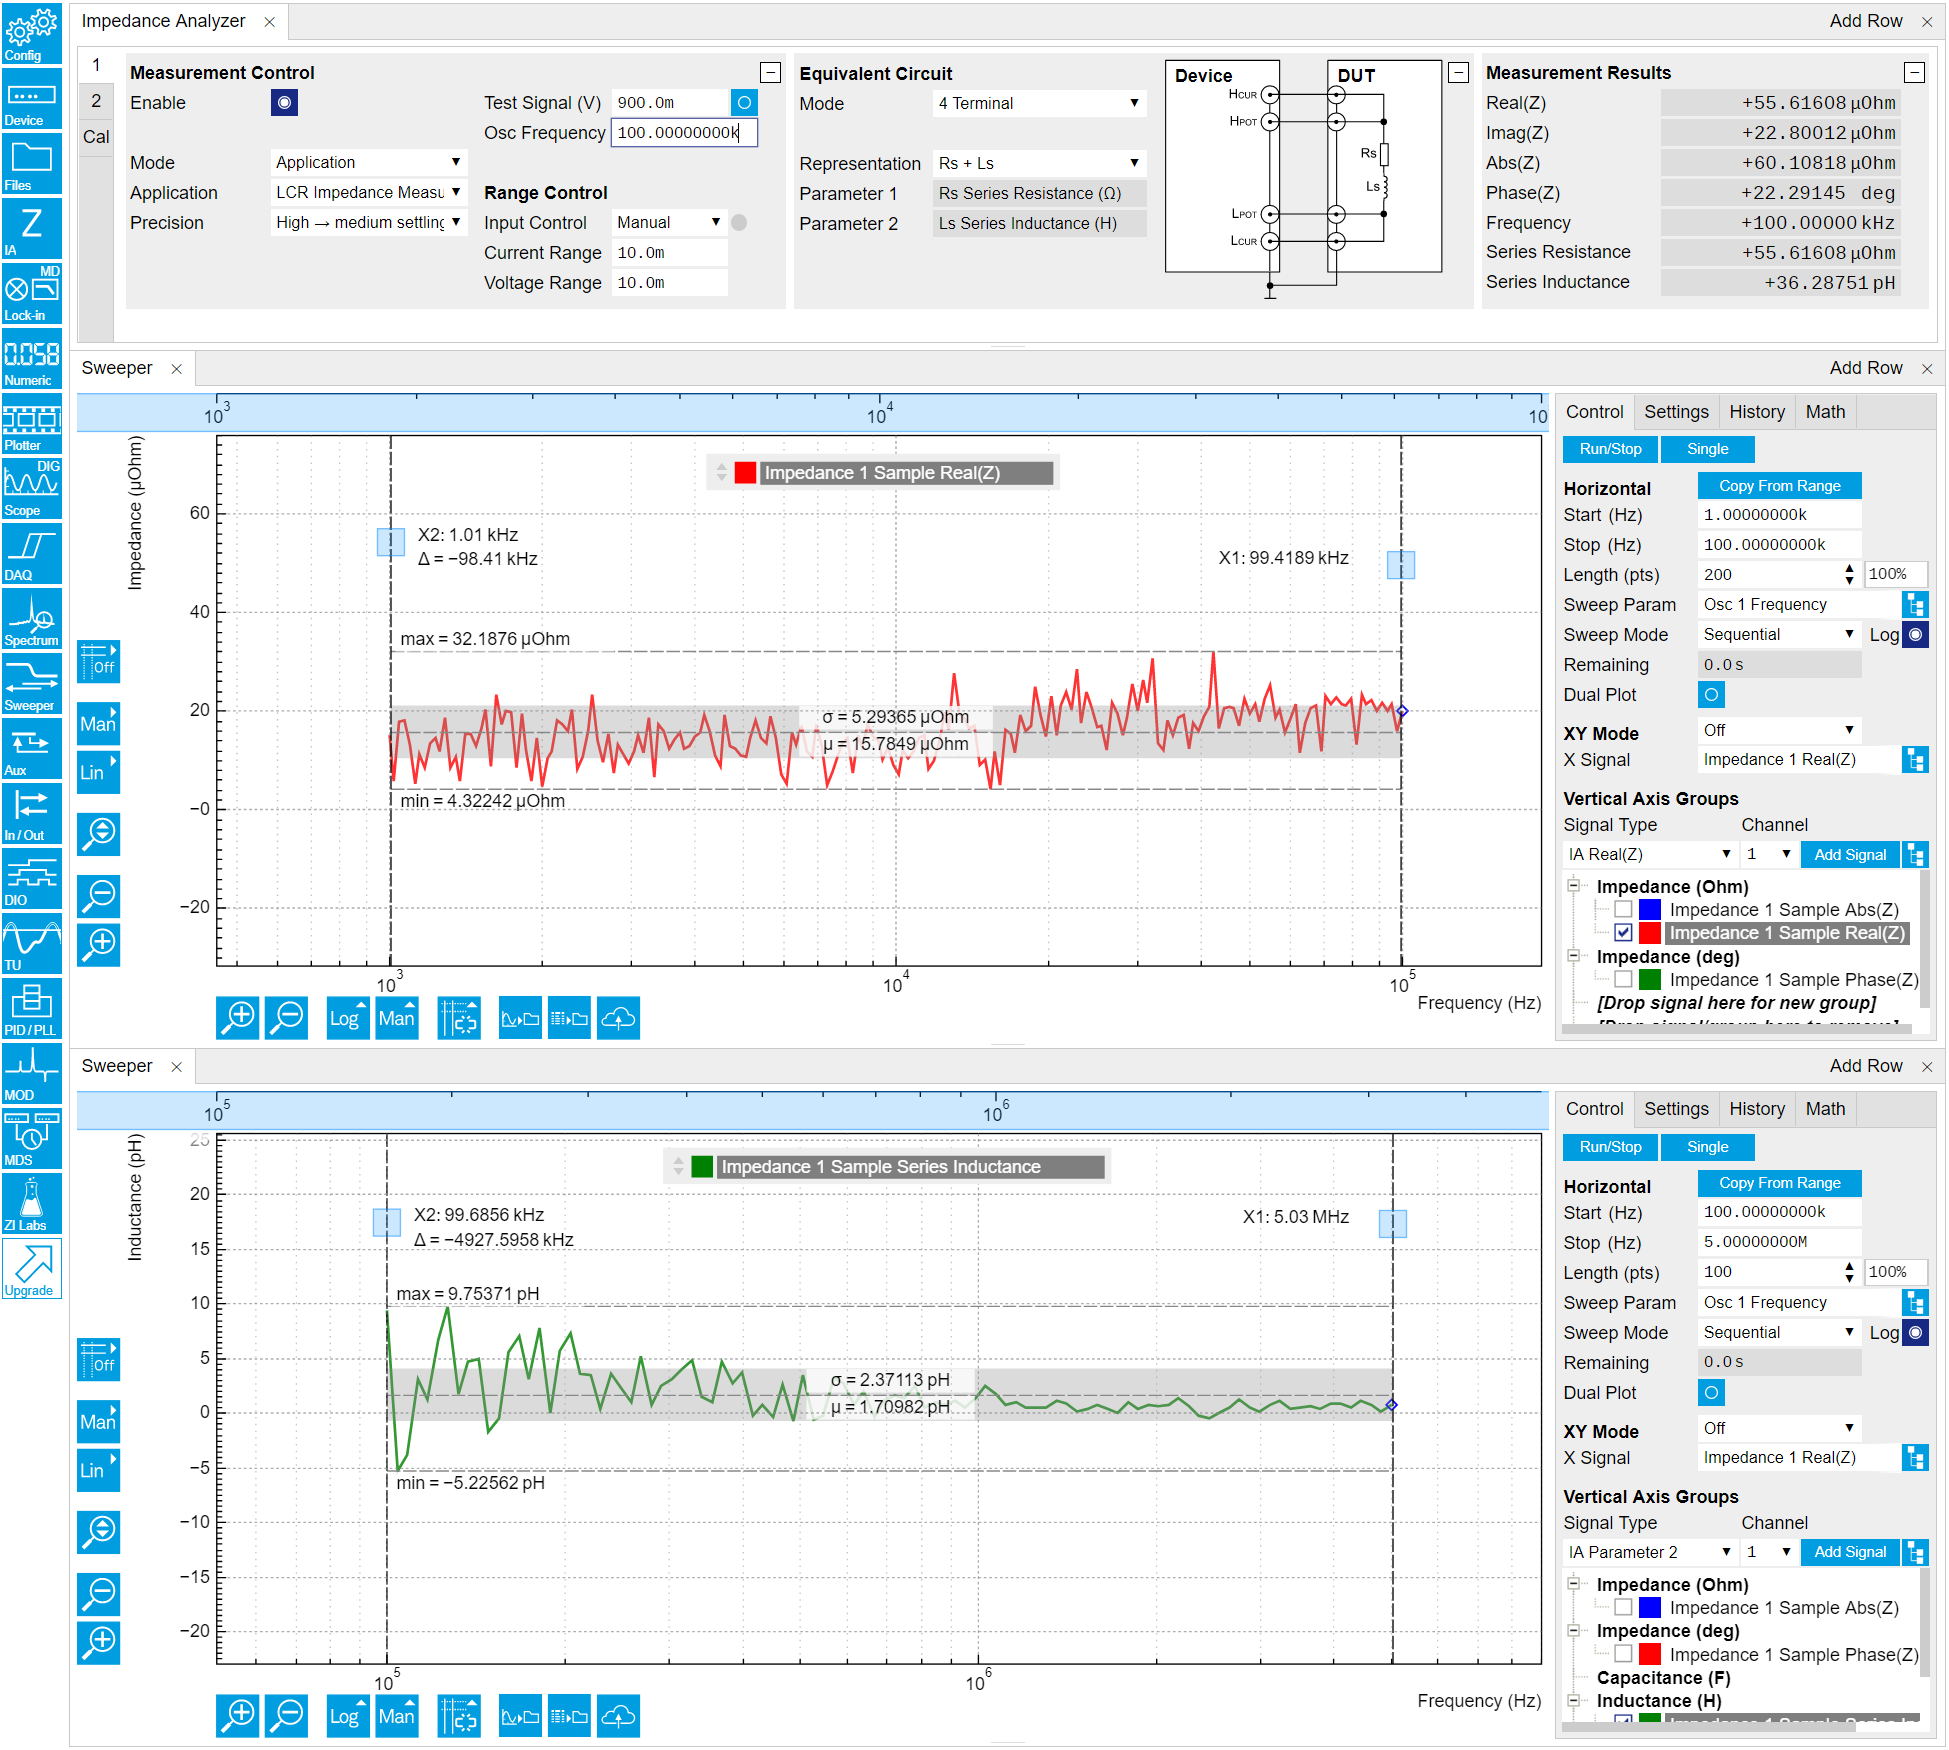
The next test is a short measurement to get an idea of the measurement baseline. Figure 4 shows a screenshot of the LabOne interface; two Sweeper windows are open to measure the real part of the impedance from 1 kHz to 100 kHz and the series inductance from 100 kHz to 5 MHz. The sweeps show a low baseline of 15.7 µΩ and 1.7 pH for the real part of the impedance and the inductance, respectively. These values are much lower than those expected for the capacitor and ensure that the subsequent measurement of the ESR or ESL of the capacitor will be reliable.
Get an overview
The next step is to measure the DC-link capacitor over the full frequency range of interest in order to examine the relevant features of the impedance.
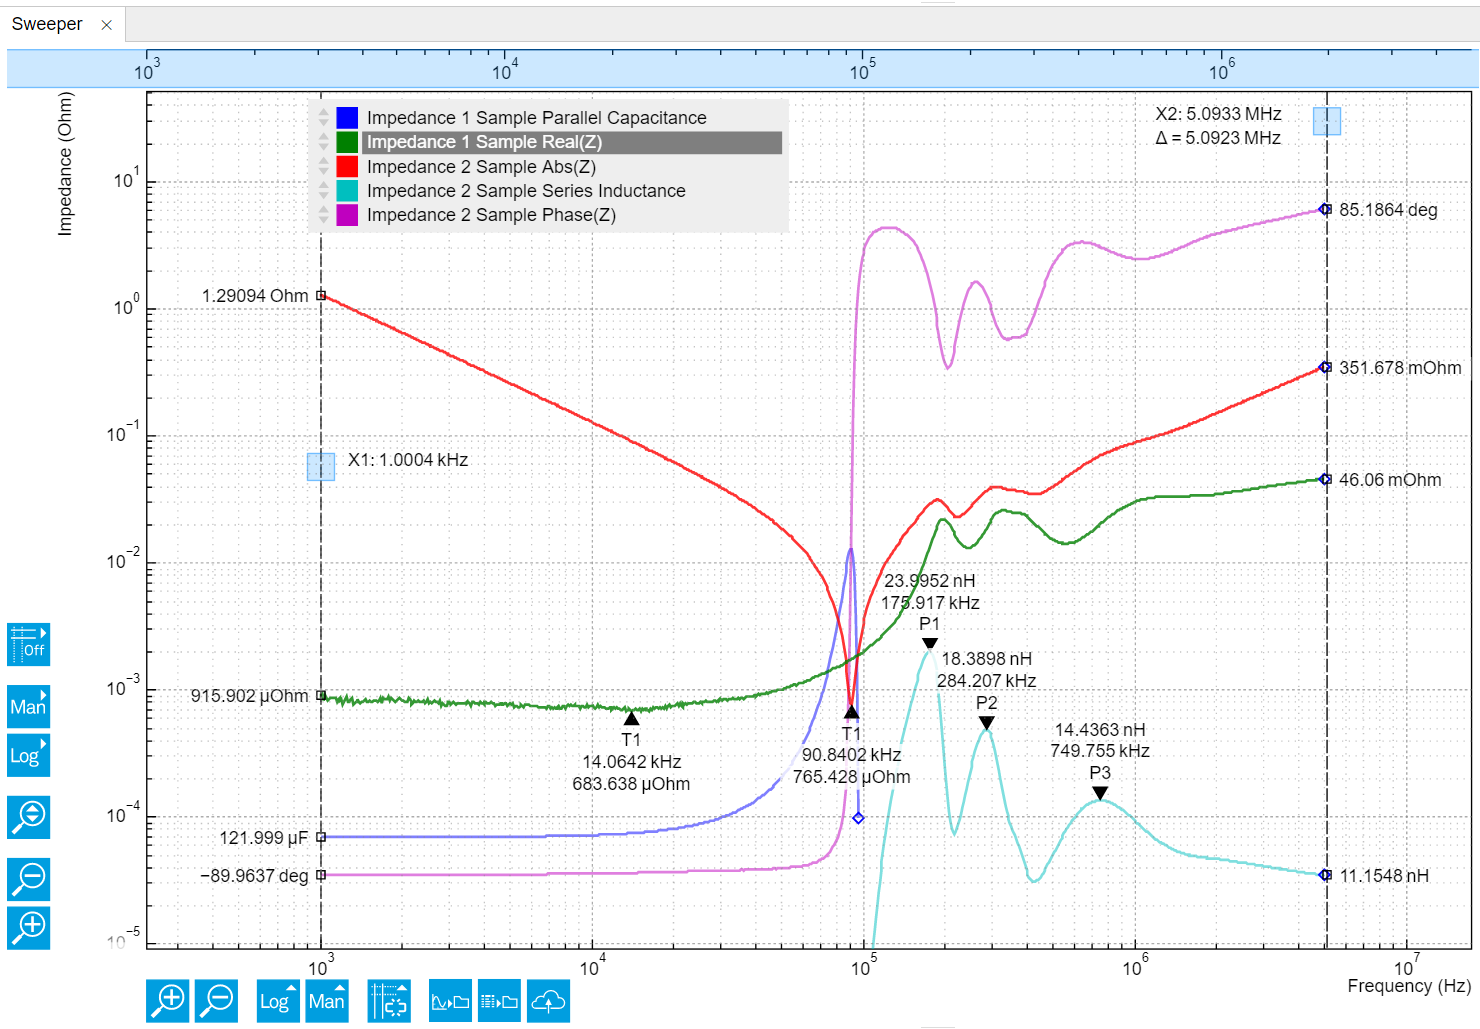
Figure 5 shows the results of a multi-trace sweep of the DC-link capacitor from 1 kHz to 5 MHz. The real part of the impedance represents the ESR. At the lowest frequency of 1 kHz, the capacitance is measured at 121.999 µF, which is consistent with the component’s nominal value of 120 uF +/- 10%. The sweep shows that the SRF is 90.8 kHz; above the SRF, the light-blue trace shows the ESL. As the frequency increases, black arrows indicate three ESL peaks at 175.9 kHz, 284.2 kHz and 749.7 kHz. In addition to the ESR and ESL, the green trace shows the absolute impedance, and the purple trace shows the phase.
Finally, take the data
It is clear from Figure 5 that the ESR should be measured at low frequency, whereas the ESL should be measured at higher frequency (above the SRF). Two LabOne Sweeper windows can be opened to cover two ranges: 1 kHz to 100 kHz (ESR) and 100 kHz to 5 MHz (ESL). As the capacitor has three different sets of electrodes (labeled U (red trace), V (green trace) and W (blue trace)), each electrode set is measured sequentially, and the measurement repeated five times to demonstrate the repeatability of the measurements.
Figure 6 shows a screenshot of the measurement, with two Sweeper windows covering the two relevant frequency ranges. The test signal amplitude is 900 mV; with the standard measurement settings, each sweep of 200 points is completed in 12 seconds.
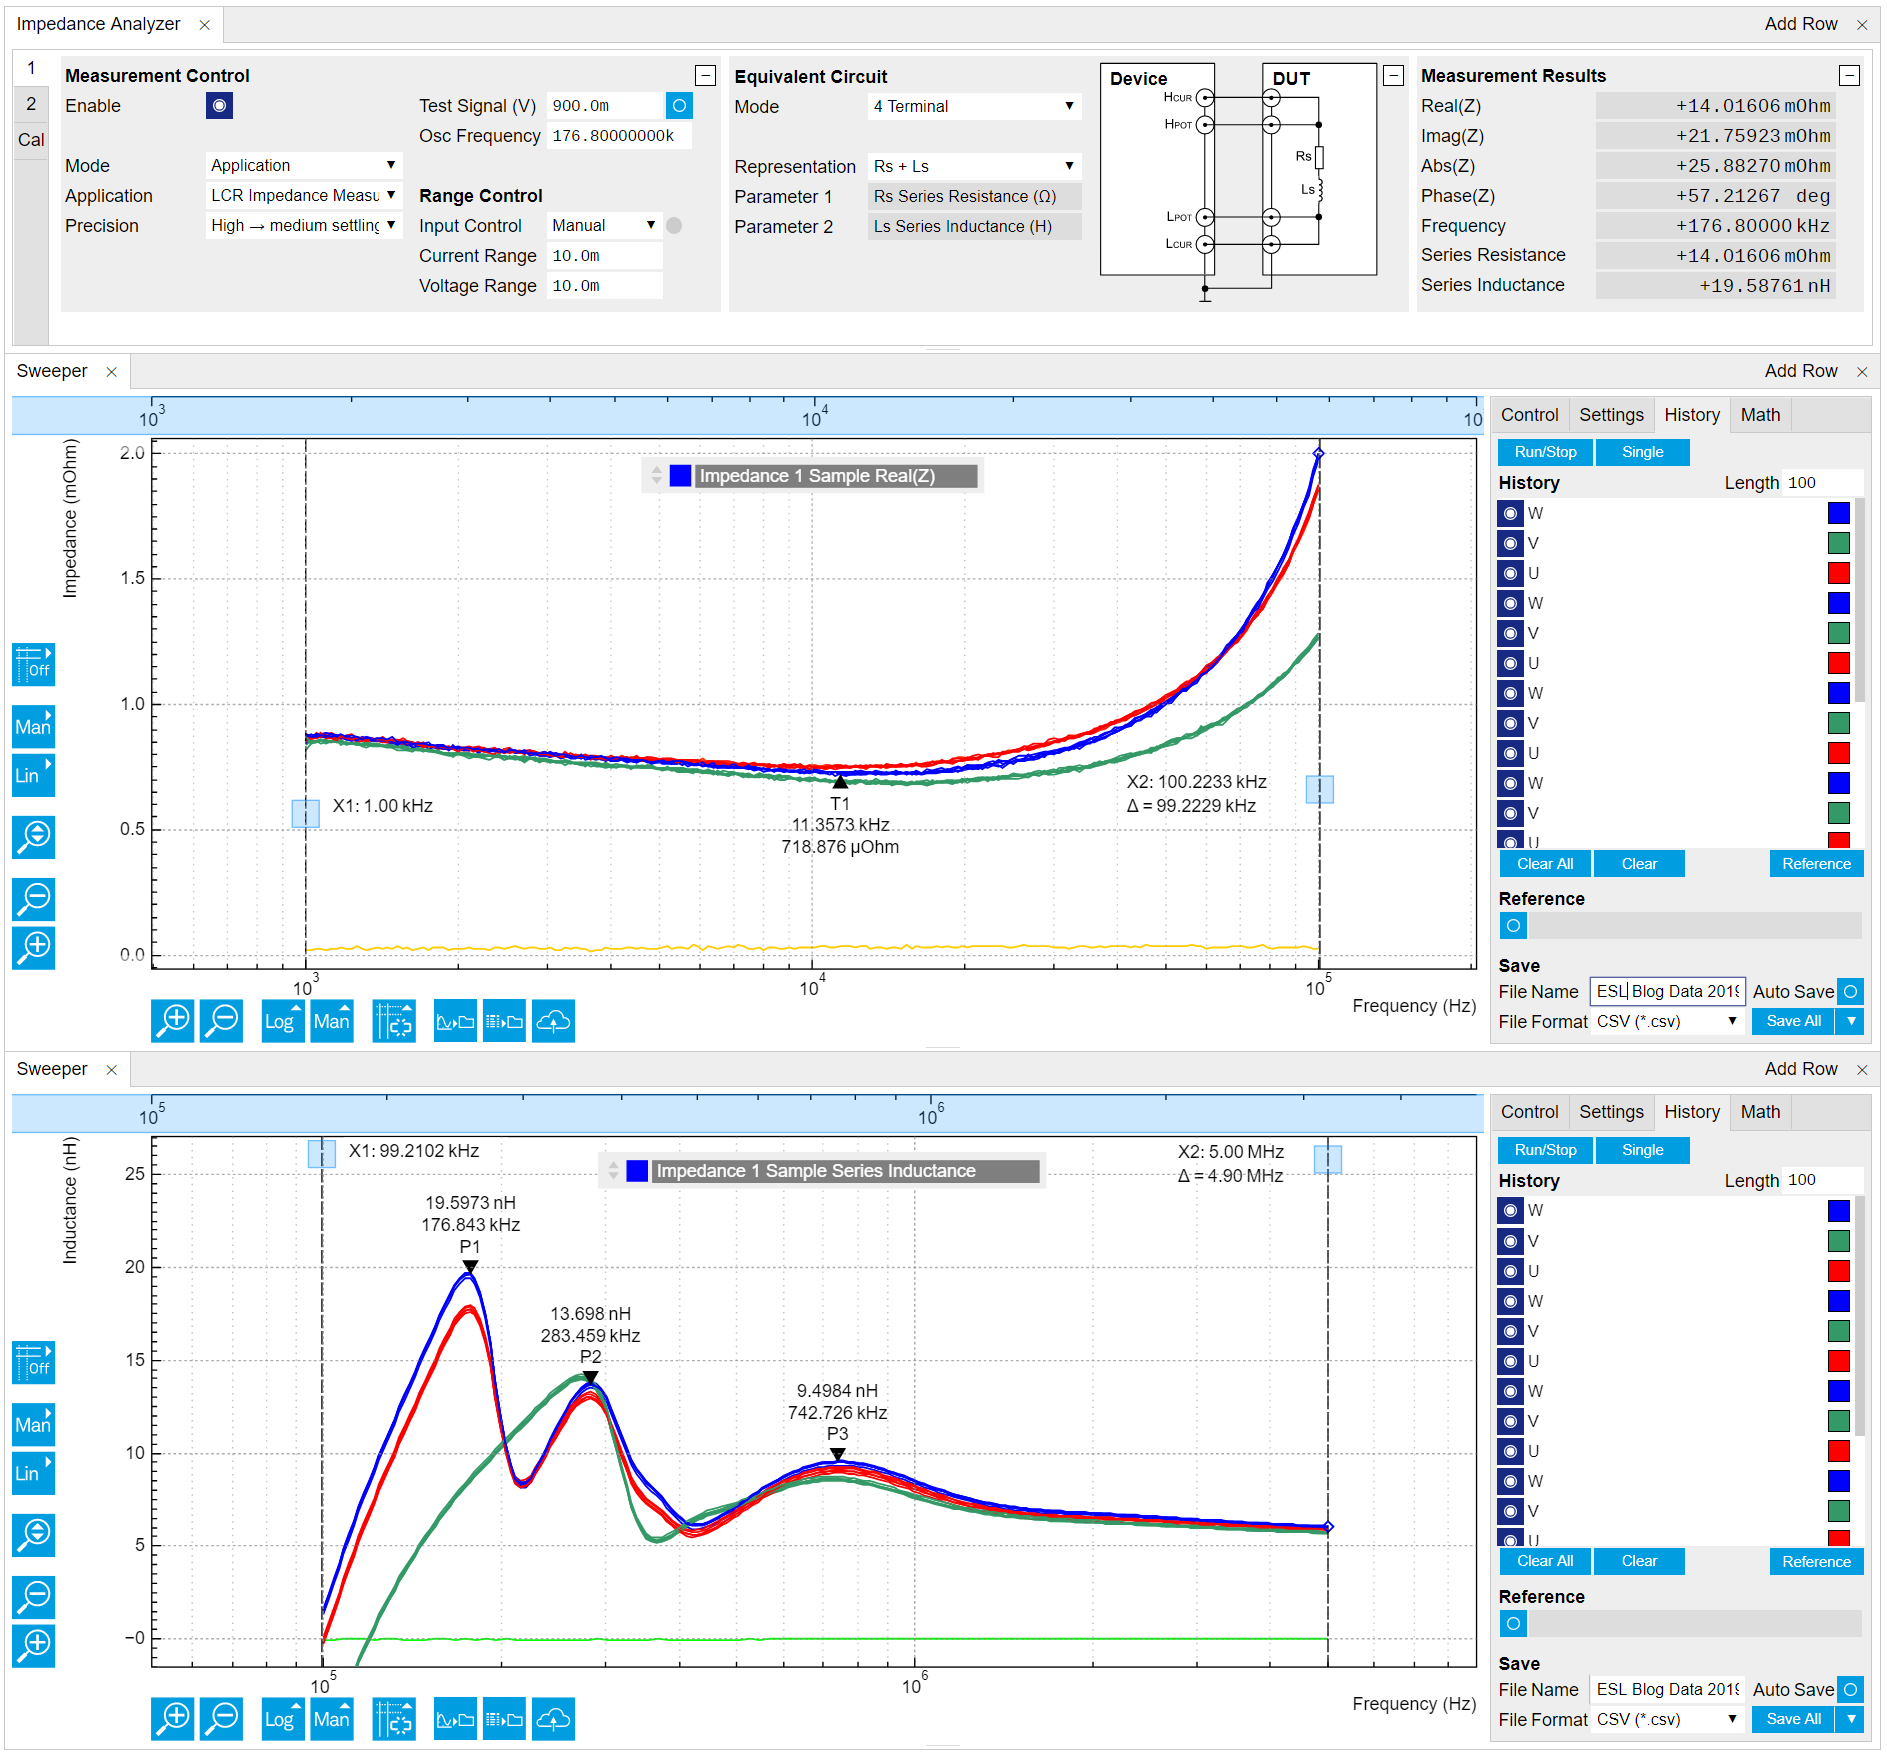
The upper window shows a sweep of the real part of the impedance, Real(Z), corresponding to the ESR. There are 15 traces on the Sweeper, color-coded to the electrode set. The traces show a high degree of overlap thanks to the excellent repeatability of the measurement even after disconnecting and reconnecting. The ESR measured using the electrodes W (blue traces) can be read from the black arrow showing 718 µΩ at 11.35 kHz. This measurement confirms the stated ESR value of 0.8 mΩ. The yellow trace in the Sweeper corresponds to a short measurement.
The lower Sweeper window in Figure 6 shows the ESL from 100 kHz to 5 MHz. Again, the traces are color-coded to match the three sets of electrodes; the overlap of the traces again shows the high degree of repeatability. Electrodes U and W show similar behaviors, showing three peaks at approximately 176 kHz, 283 kHz and 742 kHz. This is expected as the electrodes are mechanically symmetrical. In contrast, the center set of electrodes, V, shows two peaks only. The light-green trace corresponds to a short measurement.
The value of the ESL from the blue traces is 9.49 nH at 742 kHz, again confirming the datasheet value of less than 15 nH.
Conclusion
DC-Link capacitors form an essential stage in power conversion for many applications, but accurately measuring real-world parameters such as the ESR and ESL is critical to optimum design.
The Zurich Instruments MFIA is both a precision LCR meter and an impedance analyzer, and the user can seamlessly switch between the two functions. The user can also use both MFIA capabilities simultaneously thanks to the included LabOne software, which allows for multiple tabs to be accessed simultaneously.