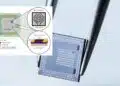








Resistor temperature coefficient describes how resistance changes with temperature, usually in parts per million per degree Celsius (ppm/°C). This article explains TCR definitions, cold and hot chord slopes, nonlinear temperature behaviour and self-heating, then shows design and component engineers how to compare specifications for precision instrumentation, resistance references and current-control circuits.
Key Takeaways
- A TCR value is meaningful only with its temperature interval, reference resistance, measurement conditions and status as a typical value or guaranteed limit.
- A chord slope describes resistance change between two temperatures. It does not automatically bound the instantaneous slope at every intermediate temperature.
- Low TCR reduces reversible temperature-related resistance changes; it does not by itself guarantee low ageing, humidity sensitivity, thermal EMF or long-term drift.
- Self-heating changes the resistive-element temperature and can introduce gradients and strain that differ from uniform ambient-temperature changes. Evaluate power-induced resistance change separately.
- For dividers and gain-setting networks, compare ratio tolerance and TCR tracking as well as the absolute TCR of individual elements.
- Validate critical resistors on the intended PCB over the actual temperature and power range rather than selecting from a headline ppm/°C value alone.
What Is Resistor Temperature Coefficient?
The temperature coefficient of resistance, abbreviated TCR, expresses relative resistance change per unit temperature change. Precision-resistor specifications commonly use ppm/°C; ppm/K has the same numerical value because a temperature difference of 1 °C equals a difference of 1 K. One ppm is one part in a million, equivalent to 0.0001%. [1]
For two resistance measurements referred to a common reference resistance, the finite-interval or chord TCR is given by Eq. (1). Here R(T1) and R(T2) are resistance values at temperatures T1 and T2, respectively; Rref is resistance at the stated reference temperature Tref; and αchord is expressed in ppm/°C. [1]
When T1 is the reference temperature, Rref = R(T1), giving the familiar two-point expression. If another temperature interval is evaluated while retaining the original reference resistance, state that normalization explicitly. Changing the denominator changes the coefficient slightly and can matter in a precise comparison.
A reference temperature of 20 °C or 25 °C is common, but the applicable datasheet controls. The reference resistance is the measured resistance at that temperature, not necessarily the nominal catalogue value. Initial tolerance and temperature coefficient describe different contributions to circuit error. [1]
For the material and thermal background, see resistivity, thermal resistance and temperature coefficient.
Reading a Published TCR Value
A specification such as ±5 ppm/°C or ±10 ppm/°C is incomplete without its temperature range and definition. A value specified from 25 °C to 125 °C must not automatically be applied below 25 °C or treated as a guaranteed local slope throughout that interval. Some datasheets provide cold and hot chord slopes, typical resistance-versus-temperature curves, production spreads or additional limits. These quantities are related, but they are not interchangeable. [1]
For example, a maximum chord magnitude of 5 ppm/°C between 25 °C and 125 °C corresponds to a maximum endpoint resistance difference of 500 ppm, or 0.05%, relative to the stated reference resistance. That endpoint statement alone does not establish the largest intermediate deviation or local temperature sensitivity.
Likewise, a typical curve is not automatically a guaranteed envelope. If a nominal chord slope and an allowed production spread are stated separately, interpret them using the supplier’s sign convention and limit definition. Do not assume that a spread value alone is the complete TCR specification.
The Relationship Between Temperature and High-Precision Resistor Performance
A resistor’s temperature is determined by both its surroundings and the power it dissipates. Temperature also changes mechanical strain within its materials and mounting system, so installed performance depends on construction, PCB layout and operating conditions as well as the resistive alloy. [1]
Ambient Temperature, Self-Heating and Mechanical Strain
Current produces Joule heating in the resistive element. Differential expansion of the element, substrate, coating and terminations can change resistance through mechanical strain. Ambient-temperature changes also affect these materials, but uniform chamber heating and internally generated heating do not necessarily create the same temperature distribution. [1]
For an initial steady-state thermal estimate, Eq. (2) relates power P, resistance R, current I, temperature rise ΔTSH and effective thermal resistance θ. Power is in watts, current in amperes, resistance in ohms and θ in K/W. This is a mounting-dependent approximation, not a substitute for an element-temperature or power-derating limit. [1]
For surface-mount resistors, effective thermal resistance depends strongly on the PCB material, pad and trace geometry, nearby heat sources and heat flow through the terminations. Soldering a precision chip onto a different substrate can also change its resistance-versus-temperature characteristic through mounting strain. [1]
Consequently, the relevant operating range is the resistive element’s temperature range, not merely the enclosure’s ambient range. This distinction is especially important for current-sense resistors, loaded dividers and feedback components close to power semiconductors.
Why Foil Construction Can Produce Low TCR
In metal-foil resistors, a resistive foil is bonded to a substrate and patterned into a resistance element. Carefully matching alloy properties, substrate expansion and element geometry allows temperature-related resistance changes and strain-related changes to partly oppose one another. This thermomechanical compensation can produce a small net TCR. [1]
The useful design principle is controlled strain, not a complete absence of stress. Neither foil construction nor a particular trimming process alone proves that the finished resistor will be immune to mounting effects, power-induced gradients or ageing. Compare published limits for the actual resistance value, package and operating range.
Thin-film, wirewound and other precision constructions also require control of material properties and mechanical effects. Technology names help identify likely trade-offs, but do not establish a universal ranking for every resistance value, power level or environment. [1]
TCR, Power Coefficient and Permanent Drift
TCR characterizes temperature-related resistance change under defined measurement conditions. Power coefficient of resistance, or PCR, characterizes resistance change associated with applied power. Depending on the datasheet, PCR may be stated as ppm/W or as a total change in ppm between specified power levels. A value in ppm at rated power is not a coefficient in ppm/W. [1][2]
At high precision, ambient-temperature TCR multiplied by a temperature rise may not fully predict power-induced resistance change. Internal gradients and differential strain can produce an additional effect. Conversely, do not count the same self-heating effect twice when combining a measured PCR with a thermal model. [1]
Long-term drift is a separate issue: resistance can change permanently with load, time, humidity, thermal cycling or overload. Low TCR reduces reversible thermal error, but load-life and environmental stability require their own specifications. Operate within the published temperature, power, voltage and pulse limits; unspecified design margin beyond those limits is not an allowable operating condition.
Interpreting TCR, Chord Slopes and Change Rate Analysis Specifications
When resistance is nonlinear with temperature, one TCR number cannot describe every aspect of its behaviour. The distinction between endpoint change and local slope becomes important when a precision circuit operates within only part of the datasheet range or experiences changing self-heating. [1]
Cold and Hot Chord Slopes
A commonly used characterization employs a cold interval from −55 °C to 25 °C and a hot interval from 25 °C to 125 °C. Their widths are 80 °C and 100 °C, respectively. These intervals are examples, not universal requirements: use the temperatures specified for the selected resistor. [1]
Both slopes should use the stated reference normalization. A small hot chord can result from cancellation of positive and negative local slopes; it does not necessarily mean that resistance is nearly constant throughout the hot interval.
Local TCR and the Choice of Denominator
Using a fixed reference resistance, the local slope αref(T) is defined by Eq. (3). It is the limiting slope of the reference-normalized resistance curve as the temperature interval approaches zero. [1]
A locally normalized coefficient instead divides by the resistance at the temperature of interest, as shown in Eq. (4). Both definitions are useful, but they are not exactly identical. Their difference is small when resistance changes are small; retaining the distinction avoids ambiguity when differentiating a plotted curve.
Quadratic Approximation and the Midpoint Rule
Measured temperature characteristics of some precision nickel-chromium alloy resistors can be approximated by a quadratic polynomial over a specified range. This is an engineering model to validate against measurements, not a universal law for every resistor material or temperature interval. [1]
Define x as T − Tref, expressed as a temperature difference in degrees Celsius, and y as relative resistance change in ppm. With the reference point subtracted, y is zero at x = 0, so the quadratic model needs no constant term. Eq. (5) is equivalent to the general form Y = aX² + bX + c after shifting the origin to the reference temperature and resistance.
Here a has units of ppm/°C² and b has units of ppm/°C. Differentiation gives the reference-normalized local slope in Eq. (6). [1]
For this quadratic model, the chord slope equals the tangent slope at the midpoint of its temperature interval. The hot interval from 25 °C to 125 °C therefore has the same reference-normalized slope as the tangent at 75 °C. The corresponding cold midpoint is −15 °C. This identity is exact for the quadratic model with a fixed denominator; it is not a general identity for arbitrary nonlinear curves. [1]
Three temperature points determine a quadratic mathematically, but additional points are needed to test whether the model adequately describes the real component. Where the curve changes shape, use measured data or a justified higher-order model rather than extrapolating a parabola.
What the Historical Foil and Thin-Film Comparison Shows
The original article reported local TCR ranges of −2.17 to +2.2 ppm/°C for a foil example, −3.6 to +7.2 ppm/°C for thin-film sample A, and −9.1 to +4.99 ppm/°C for thin-film sample B over −55 °C to +125 °C. The corresponding peak-to-peak spans, calculated from those printed endpoints, are 4.37 ppm/°C, 10.8 ppm/°C and 14.09 ppm/°C. These are spans of local slopes, not total resistance changes. [3]
A historical manufacturer technical note provides the underlying methodological context: resistance curves and derived local slopes were examined for selected foil and thin-film samples, with different curvature among the samples. Its results illustrate why a broad-range chord specification may not predict the slope within a narrower application range. They are not a representative benchmark of all current foil or thin-film products. [1]
A local slope greater than a published chord limit does not, by itself, demonstrate nonconformance. Compliance must be assessed against the actual datasheet definition, temperature points, production limits and test method. Equally, a low average chord slope does not prove low sensitivity at every operating temperature.
Absolute TCR Versus Ratio Tracking
In a voltage divider or amplifier feedback network, the resistance ratio may matter more than either absolute resistance. Closely matched temperature characteristics can keep that ratio stable even when both elements change appreciably with temperature. Conversely, two individually low-TCR resistors do not automatically have closely matched temperature curves. [1]
Compare specified ratio tolerance and TCR tracking directly. A common substrate can improve thermal coupling, but unequal dissipation or nearby heat sources can still create an element-to-element temperature difference and ratio error. Mounting symmetry and power distribution remain important even with a precision network. [1]
The Benefits of Low TCR in High-Precision Resistor Applications
Low TCR is valuable where resistance determines a measurement scale, reference value or regulated current. The following historical application examples retain the original article’s design logic while separating reported component characteristics from the complete instrument’s performance. [2]
Precision Instrumentation
In the reported Transmille example, the company selected a foil resistor for a family of 8.5-digit and 7.5-digit digital multimeters. The design requirements included low TCR, repeatability, low thermal EMF, low excess noise, long-term stability and low distortion. These characteristics addressed different error mechanisms; none could be replaced by a TCR specification alone. [2]
The case report quotes TCR below 1 ppm/°C at 20 °C, a power-induced resistance change of 5 ppm at rated power, load-life changes of ±0.005% after 2000 h at 70 °C and ±0.015% after 10 000 h, and thermal EMF below 0.05 µV/°C. Those load-life percentages correspond to ±50 ppm and ±150 ppm, respectively. They describe the reported component and test conditions, not generic limits for foil resistors. [2]
A TCR value associated with one temperature does not define the full operating-temperature curve. Similarly, display digits describe resolution rather than establishing measurement accuracy. Overall DMM accuracy also depends on the reference, converter, gain and offset errors, calibration, temperature, noise and elapsed time.
The engineering lesson is to budget these contributions separately. Low TCR can reduce warm-up and ambient-temperature errors, but the resistor’s load-life limits and the instrument’s calibration specification still govern long-term performance. Low excess noise must also not be interpreted as an absence of thermal noise.
Metrology Secondary Reference
The original VSL example concerned secondary resistance references compared with quantum Hall resistance standards at approximately 12.9 kΩ and 6.45 kΩ. The required properties included suitable resistance values, four-terminal connections, low noise, low TCR, humidity protection and long-term stability. [2]
The reported construction combined 11 resistive elements in a housing with hermetic sealing and oil fill. The assembly approach addressed thermal behaviour and environmental sensitivity; it should not be assumed that simply increasing the number of elements always improves TCR or drift. [2]
The case report describes operation in an enclosure controlled at 29.00 °C with a stated variation of ±0.02 °C and comparison against the quantum Hall reference over more than five years. It separately reports temperature coefficients below 0.5 ppm/°C over 18 °C to 28 °C, compared with an initial 2 ppm/°C specification over −55 °C to +125 °C. The narrower-range characterization and wider-range specification describe different intervals and are not directly interchangeable. [2]
Temperature coefficient and multiyear drift must remain separate quantities. The temperature characterization describes sensitivity to temperature; the long comparison history assesses stability with time. Thermostatic control reduces the contribution from ambient variation but does not eliminate the need to characterize ageing, power effects and the measurement system.
Diode Laser Current Drivers
The California State University example described a low-cost, low-noise current source for laboratory diode lasers. A current-setting resistor needed to remain stable under both ambient changes and self-heating while providing adequate power capability and low thermal EMF. [2]
The reported foil component had a typical TCR of 2 ppm/°C from −55 °C to +125 °C, referenced to 25 °C, an initial tolerance of 0.01% and a 10 W power rating. The tolerance is equivalent to 100 ppm. These values describe distinct properties: initial setting accuracy, temperature response and permitted dissipation under the specified mounting conditions. [2]
In a current regulator whose feedback loop maintains a voltage across a sense resistor, resistance drift changes the regulated current. Selecting the sense voltage involves a trade-off: a larger voltage eases measurement relative to amplifier offset and thermal EMF, but increases dissipation and consumes voltage headroom.
The resistor is only one contributor to laser-current stability. Reference drift, amplifier offset, control-loop noise, wiring and thermal conditions must also be considered. A typical TCR is not a guaranteed maximum, and a 10 W rating does not imply that operating at 10 W is compatible with the required current stability.
The Value of TCR in High-Precision Resistor Selection
TCR is useful when it is connected to a circuit-level error budget and the actual operating conditions. Select the least complex component solution that meets the required initial accuracy, thermal behaviour, life stability and qualification requirements.
Design and Selection Checklist
- Define the controlled quantity: absolute resistance, regulated current, divider ratio, gain or another circuit parameter.
- Compare TCR definitions: reference temperature, cold and hot intervals, chord or local interpretation, typical curves and guaranteed production limits.
- Check resistance-value and package restrictions. A low-TCR option may not cover every value or size within a product family.
- Calculate actual dissipation and assess ambient temperature, nearby heat sources, PCB heat spreading and power-induced resistance change.
- For ratio circuits, compare ratio tolerance, TCR tracking, unequal element heating and long-term ratio stability.
- Review load-life change, humidity sensitivity, thermal cycling, thermal EMF, excess noise and voltage coefficient where they affect the error budget.
- Prefer a catalogue component when its guaranteed limits are sufficient. Specify a custom value, matched network or characterized temperature curve only when the application needs it, with agreed acceptance tests and change control.
- Verify the exact ordering code, qualification evidence, traceability and permitted substitutions. Equivalent nominal resistance and headline TCR do not establish interchangeability.
- Check power derating, working voltage, pulse capability and system-level safety requirements independently. Low TCR is not a safety rating or an overload qualification.
- Validate the chosen part in its intended assembly and document measurement uncertainty, calibration assumptions and acceptance limits.
For precision signal and metrology circuits, temperature curvature, tracking, thermal EMF and drift can dominate selection. For power converters and high-current sensing, also prioritize fault pulses, current-path geometry, Kelvin connections and installed-board temperature rise. A precision temperature characteristic does not establish suitability for fast switching or surge duty.
Measuring and Validating TCR
Measure resistance at a sufficiently low power that self-heating is insignificant for the required uncertainty. Establish the reference reading, allow the component and fixture to reach thermal equilibrium at each test temperature, and include points within the actual operating range rather than measuring only the category endpoints. The historical technical note uses low-power resistance measurements and multipoint temperature characterization for this purpose. [1]
Use four-terminal connections where lead and contact resistance would be significant. Control temperature gradients and thermoelectric offsets, and use current reversal where supported by the measurement system. A return measurement at the reference temperature helps reveal hysteresis or permanent changes introduced during the sequence.
Measure temperature close enough to the component to establish its thermal condition; chamber setpoint alone is not proof of element equilibrium. Record the mounting method, current, dissipated power, temperature points, settling criterion, instrument settings and normalization resistance.
Report the result with an uncertainty appropriate to the resistance and temperature differences being measured. Instrument resolution alone does not establish that uncertainty. Differentiating a noisy fitted curve can magnify errors, so do not report finely resolved local TCR values unless the data and model support them.
Finally, run a separate powered test on the intended PCB. Changes caused by operating dissipation, nearby components and temperature gradients are part of installed performance even when the low-power chamber TCR meets its specification. [1]
Conclusion
A useful TCR specification combines a resistance normalization, a temperature interval, a test method and a clearly defined limit. Chord slopes, local slopes and resistance-change curves provide different information; understanding their relationship prevents misleading comparisons and incorrect temperature-error estimates.
Low TCR is valuable in precision instrumentation, secondary resistance references and current regulators, but it must be considered alongside self-heating, ratio tracking, initial tolerance, long-term drift and environmental performance. Select from the exact component specification and validate critical behaviour in the final assembly.
FAQ
The temperature coefficient of resistance, or TCR, describes relative resistance change per degree of temperature change. It is commonly expressed in ppm/°C. A useful specification identifies the temperature interval, reference resistance and measurement conditions. Initial resistance tolerance is a separate parameter and does not describe temperature stability.
Subtract the resistance at the first temperature from the resistance at the second temperature. Divide that difference by the stated reference resistance and by the temperature difference, then multiply by one million. Report the temperature points and reference resistance with the result because different normalization choices can produce slightly different coefficients.
Chord TCR is the average normalized slope between two temperature points. Local TCR is the slope at a particular temperature. When resistance varies nonlinearly with temperature, the local slope can differ substantially from the chord slope. A published chord limit therefore does not automatically guarantee the same limit at every intermediate temperature.
No. Low TCR reduces reversible resistance changes associated with temperature, but ageing, humidity, load-life drift and overload damage are separate effects. A precision selection must compare those characteristics individually. Thermal EMF, excess noise, initial tolerance and power-induced resistance change can also limit circuit performance even when the resistor has a low TCR.
Dissipated power raises the resistive-element temperature and can change resistance. Internal heating may also create temperature gradients and strain that differ from uniform ambient heating. Evaluate the actual mounting arrangement and the specified power-induced resistance change. Avoid counting the same self-heating effect twice when combining a thermal model with measured PCR data.
TCR tracking is especially important when a circuit depends on a resistance ratio, as in a divider or amplifier feedback network. Closely matched elements can maintain a stable ratio even while their individual resistances change. Check ratio tolerance and tracking directly, and assess unequal self-heating because a common package does not eliminate temperature gradients.
How to Evaluate TCR in a Precision Resistor
Evaluate the temperature characteristic and installed performance of a precision resistor.
- Define the application and error budget
Identify whether absolute resistance, current or resistance ratio controls the required accuracy. Establish the operating temperature and power range, then allocate separate allowances for temperature response, initial tolerance, self-heating and long-term drift.
- Check the datasheet definition
Record the reference temperature, temperature intervals, reference resistance and whether each TCR value is typical or guaranteed. Distinguish chord slopes from local slopes and check ratio tracking when the circuit depends on a resistance ratio.
- Measure the low-power temperature characteristic
Use a measurement current that makes self-heating insignificant for the required uncertainty. Measure resistance at the reference temperature and at multiple operating temperatures after thermal equilibrium. Use four-terminal connections where necessary and record the mounting arrangement and measurement conditions.
- Calculate slopes and check repeatability
Calculate chord slopes using the stated reference normalization and convert the result to ppm/°C. Use a fitted curve only when the measured points support the model. Return to the reference temperature to check repeatability, hysteresis and permanent resistance change.
- Validate powered operation on the final PCB
Apply the intended operating loads and assess resistance or circuit error as the assembly warms. Include nearby heat sources, thermal gradients and unequal network-element dissipation. Compare the measured result with the complete error budget and verify all power, voltage, pulse and qualification requirements.
Further Reading
These related articles extend the discussion to construction, ratio stability, current sensing and other resistance-error mechanisms.
- Resistor Types and Construction Fundamentals — explains how resistive materials, substrates and packages influence component behaviour.
- Resistor Networks — develops ratio tolerance, temperature tracking and unequal self-heating in multi-element components.
- Current Sense Shunt Resistors — covers resistance selection, Kelvin connections and thermal errors in current measurement.
- Voltage Coefficient of Resistance — distinguishes voltage-dependent nonlinearity from temperature-driven resistance changes.
- SMD Chip Resistors: Types, Packages, Ratings and Design Guide — connects precision requirements with package ratings, mounting and application limits.
References
The technical note supports the temperature-curve analysis. The application report and original article document the historical examples and comparison values discussed above.
- Felix Zandman and Joseph Szwarc, Non-Linearity of Resistance/Temperature Characteristic: Its Influence on Performance of Precision Resistors, Vishay Intertechnology, written 2008, revised 2009, document 60108.
- Reuven Goldstein and Molly Bakewell Chamberlin, Understanding Temperature Coefficient of Resistance (TCR), doEEEt / ALTER Technology, 2025.
- Passive Components Blog, Original published article record: TCR: What is High-Precision Resistor Temperature Coefficient of Resistance, originally published 2017; historical comparison values retained from the pre-update article.