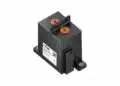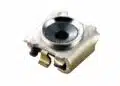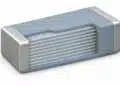

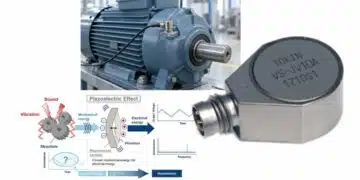






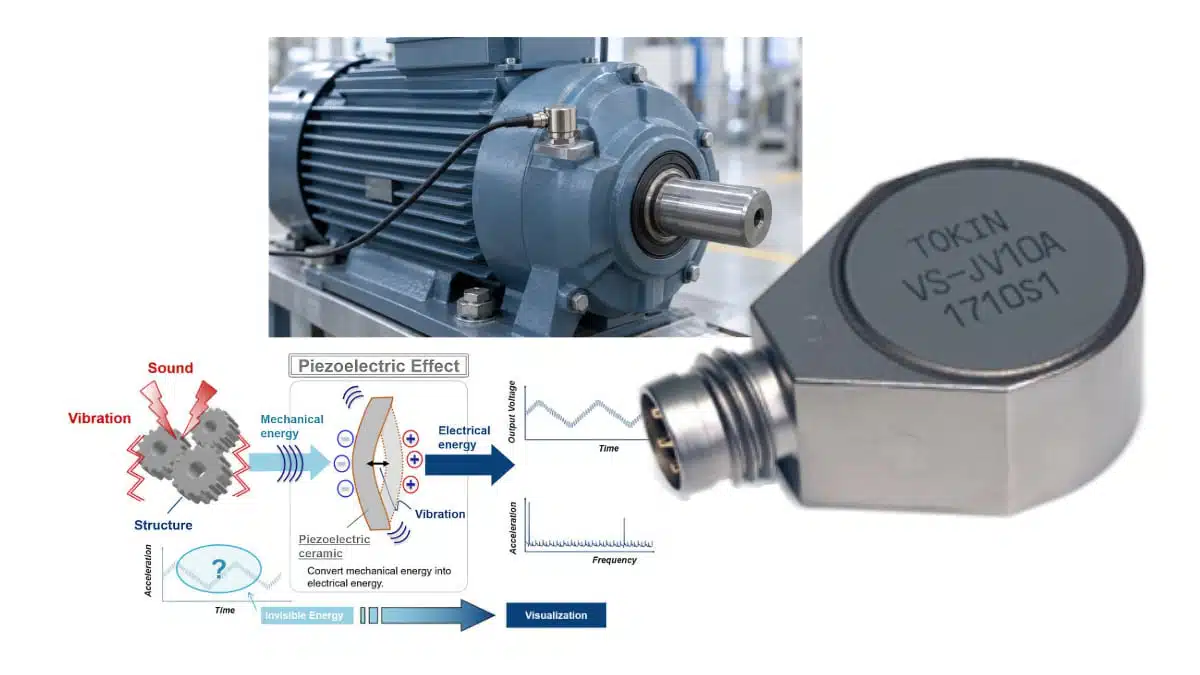
YAGEO Group’s VS series piezoelectric vibration sensors combine a ceramic sensing element and built-in amplifier for industrial condition monitoring.
From Preventive to Predictive Maintenance with Vibration Sensors
Scheduled maintenance reduces the risk of machinery failure, but a fixed service interval cannot show how a bearing, coupling or mounting point is deteriorating between inspections. Vibration-based condition monitoring adds that missing information, allowing maintenance decisions to follow measured equipment condition rather than elapsed time alone.
YAGEO Group’s VS series piezoelectric vibration sensors combine a ceramic sensing element and built-in amplifier for monitoring motors, bearings and pumps. Their 10 Hz to 15 kHz frequency range provides the measurement input for a maintenance workflow that extends from detecting abnormal vibration to diagnosing faults and tracking their progression.
Why scheduled preventive maintenance needs condition data
Machine reliability does not remain fixed after installation. Bearing surfaces wear, lubrication conditions change, mounting joints loosen and alignment can shift during operation. These changes can develop gradually while equipment continues to perform its intended function.
Scheduled preventive maintenance addresses this deterioration through servicing at predetermined time or usage intervals. It makes inspection, lubrication and component replacement easier to plan, but the schedule does not directly measure the condition of the individual machine.
This creates two opposing problems. A healthy component may be replaced before its useful life has been consumed, while a fault developing between scheduled inspections may progress without being detected. Opening or disturbing otherwise healthy equipment can also introduce maintenance-related damage.
Condition monitoring adds a different trigger for intervention: a measurable change in equipment health. Rather than relying on the calendar to indicate when attention is needed, maintenance teams can follow changes in vibration amplitude, frequency content and other condition indicators.
Corrective, preventive and predictive maintenance
The important distinction is what triggers the maintenance action.
| Maintenance approach | Action trigger | Main consideration |
|---|---|---|
| Corrective | Functional failure | Repair follows the breakdown |
| Scheduled preventive | Time or usage interval | Service may not match actual wear |
| Condition-based | Measured deterioration | Requires sensing and a baseline |
| Predictive | Estimated degradation trajectory | Requires diagnosis and prognosis |
Scheduled preventive and condition-based maintenance both seek to act before failure. Their difference is whether the intervention follows a predetermined interval or the measured condition of the asset.
Predictive maintenance builds on condition monitoring by assessing how degradation is progressing and estimating when intervention will be required. Detecting an abnormal signal is therefore not the same as predicting a failure date.
From condition monitoring to predictive maintenance
A useful monitoring system must answer three different questions:
- Detection: has the machine’s behaviour changed?
- Diagnosis: what fault or operating condition could explain that change?
- Prognosis: how is the condition developing, and how much useful operating time may remain?
A vibration alarm can indicate that a machine needs attention. Frequency-domain analysis can help distinguish possible causes, such as imbalance, looseness or bearing damage. Prognosis then uses the development of condition indicators to estimate the remaining time available for action.
This distinction matters when defining a monitoring project. A sensor and an alarm threshold can support condition-based maintenance, but remaining-useful-life estimation requires additional analysis. The sensor provides the physical measurement; the predictive capability comes from the complete acquisition, processing and decision-making system.
The maintenance workflow
The workflow begins with vibration acquisition and continues through signal processing, fault assessment and maintenance planning.
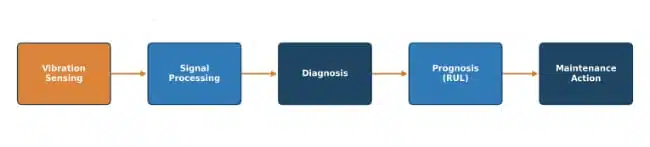
The individual stages have different roles:
- Acquisition captures the vibration waveform at a defined location on the machine.
- Signal processing converts the waveform into useful indicators, including statistical values and frequency spectra.
- Diagnosis evaluates whether a fault is developing and what mechanism may be responsible.
- Prognosis assesses the progression of degradation and estimates remaining useful life.
- Maintenance planning converts that assessment into an inspection, adjustment or replacement task.
The practical objective is not simply to collect more data. It is to create enough warning and diagnostic information to arrange maintenance before a developing fault becomes an unplanned stoppage.
Why vibration is central to rotating-machine monitoring
Mechanical faults change how forces are transmitted through a machine. Imbalance, misalignment, looseness, gear deterioration and bearing damage can therefore produce changes in the vibration measured at the housing.
The useful information lies in both the amplitude and the structure of the signal. An increase in overall vibration can show that something has changed, while the frequency spectrum helps determine where that change occurs.
Different mechanisms produce different types of response:
- Imbalance produces a prominent component at rotational frequency.
- Misalignment can increase vibration at rotational frequency and its harmonics, including axial vibration.
- Mechanical looseness can introduce multiple harmonics.
- Bearing deterioration can produce impulsive behaviour and higher-frequency vibration components.
- Gear deterioration can change gear-mesh components and their sidebands.
Vibration-based predictive maintenance therefore depends on more than measuring a single overall level. The measurement bandwidth, mounting arrangement and processing method must preserve the features associated with the faults being monitored.
Vibration is also part of a wider condition-monitoring toolkit. Thermography addresses heating-related conditions, electrical-signature analysis addresses motor electrical faults, and oil analysis examines lubricant condition and wear debris. These methods complement vibration measurements rather than replacing the need to match the sensing technique to the failure mechanism.
Key features and benefits
- Piezoelectric ceramic sensing with integrated amplification.
- Frequency coverage from 10 Hz to 15 kHz.
- Sensitivities of 2, 10 and 20 mV/(m/s²), with measurement ranges from ±50 to ±500 m/s².
- J-type sensors with detachable cables and B-type sensors with integrated cables.
- Supply-voltage ranges of 3.2–5.5 V for J-type models and 3.0–5.5 V for B-type models.
Piezoelectric sensing and integrated amplification
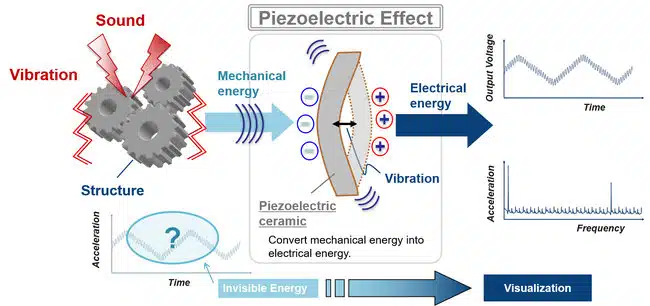
Mechanical vibration deforms the piezoelectric ceramic element, generating an electrical response. The built-in amplifier converts this response into a voltage signal for acquisition and analysis, removing the external charge-amplifier stage.
Technical highlights
Sensitivity and acceleration range
| Model | Sensitivity at 160 Hz | Measurement range at 160 Hz | Sensitivity tolerance |
|---|---|---|---|
| VS-JV02A | 2 mV/(m/s²) | ±500 m/s² | ±15% |
| VS-JV10A | 10 mV/(m/s²) | ±100 m/s² | ±15% |
| VS-BV021-B | 2 mV/(m/s²) | ±500 m/s² | ±20% |
| VS-BV203-B | 20 mV/(m/s²) | ±50 m/s² | ±20% |
These sensitivity and measurement-range values apply at 160 Hz, with sensitivity measured along the Z axis. All four models cover 10 Hz to 15 kHz and have a resonant frequency above 30 kHz.
The selection trade-off is sensitivity versus acceleration range. The VS-BV203-B produces a larger voltage change for a given acceleration but has a ±50 m/s² measurement range. The 2 mV/(m/s²) models accommodate ±500 m/s², while the VS-JV10A provides an intermediate sensitivity and range.
Mechanical formats
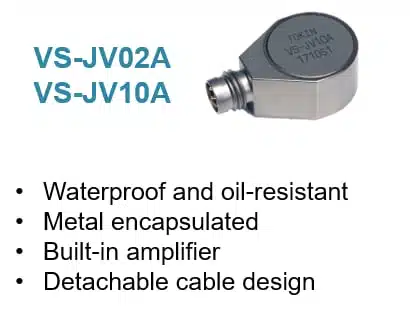
The J-type VS-JV02A and VS-JV10A use cylindrical housings with an 18.0 mm diameter and an 11.0 ±0.5 mm body height. An M4 × 0.7 female mounting thread and detachable M8 connection support installation using mounting studs or magnetic bases.
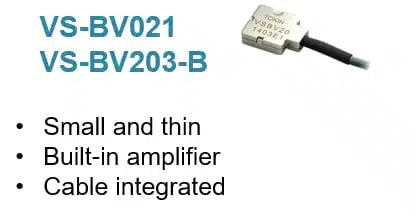
The B-type VS-BV021-B and VS-BV203-B measure 8.4 ±0.5 mm × 11.4 ±0.5 mm × 2.9 ±0.5 mm. Their integrated cables are 1 m and 3 m long, respectively. This format supports embedding the sensor where the available mounting envelope cannot accommodate the cylindrical J-type housing.
Power supply and analog interface
| Parameter | J-type models | B-type models |
|---|---|---|
| Supply voltage | 3.2–5.5 V | 3.0–5.5 V |
| Typical supply voltage | 5 V | 3.3 V |
| Typical current consumption | 0.50 mA | 0.35 mA |
| Output offset | 1.5 V center value | Half the supply voltage |
| Minimum output load resistance | 100 kΩ | 100 kΩ |
| Operating temperature | −25 °C to +85 °C | −25 °C to +75 °C |
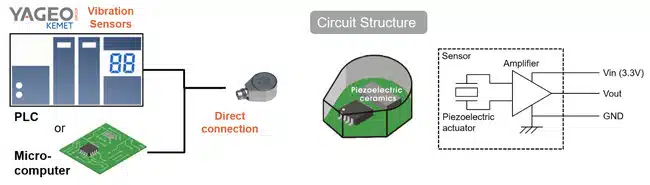
The output contains a vibration-dependent AC component around a DC offset. The receiving analog input must accommodate that offset, the expected signal swing and the output-loading requirement.
Typical applications
Pump condition monitoring
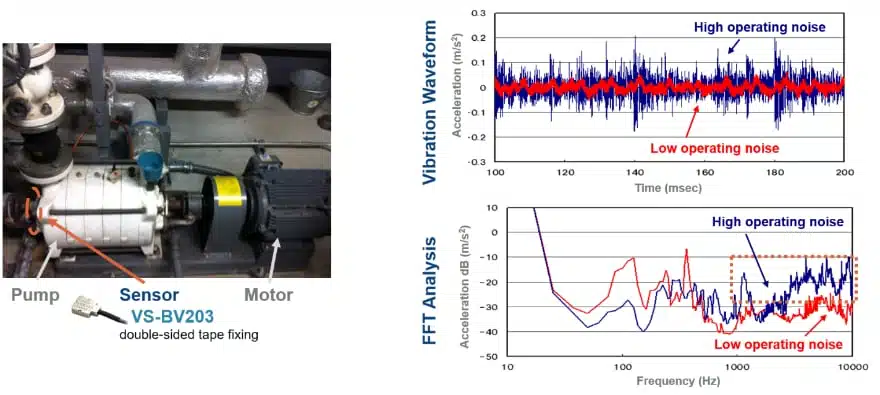
Pump monitoring can compare vibration waveforms and frequency spectra against an equipment-specific baseline. A VS-BV203 measurement comparing pumps with different operating sounds showed stronger high-frequency vibration components in the noisier pump, consistent with bearing wear.
Motor mounting and bearing-housing looseness
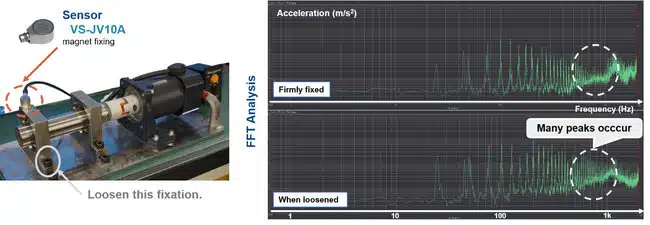
A VS-JV10A measurement compared a firmly fixed motor bearing housing with a deliberately loosened housing. The loosened condition produced additional FFT peaks between 500 Hz and 1 kHz. Frequency-domain analysis can reveal changes that an overall vibration-amplitude measurement does not distinguish.
Bearing damage detection
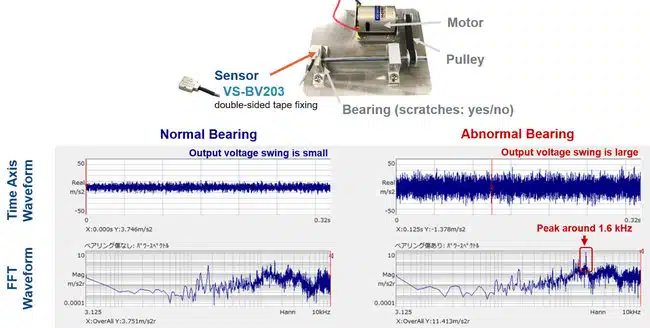
A bearing comparison using a VS-BV203 sensor produced a larger time-domain output swing and a spectral peak around 1.6 kHz in the damaged condition. The healthy bearing produced a lower response. This frequency is specific to the measurement example, not a universal bearing-fault threshold.
Turning vibration measurements into maintenance decisions
The pump, motor and bearing examples demonstrate a common principle: a change in mechanical condition produces a measurable change in the vibration signal. Their maintenance value comes from linking that change to a repeatable measurement and an appropriate response.
A comparison between healthy and damaged equipment demonstrates fault discrimination. An operating maintenance programme adds a time dimension by measuring the same asset repeatedly and following how its indicators develop.
Establishing a meaningful baseline
A baseline records the machine’s vibration under representative operating conditions. It provides the reference against which later measurements are assessed.
The baseline should reflect the measurement location, sensor orientation, mounting method, operating speed and load. These factors affect the vibration signal and therefore the interpretation of subsequent changes.
A higher reading does not automatically establish the presence of damage. The comparison must distinguish a change in machine condition from a change in operating conditions or measurement setup.
The baseline is particularly important when moving from isolated measurements to continuous monitoring. A permanently installed sensor provides a consistent measurement point, allowing changes to be tracked over time rather than assessed as unrelated snapshots.
Using time-domain and frequency-domain indicators together
Time-domain analysis extracts indicators directly from the waveform. Root-mean-square amplitude, crest factor and kurtosis can help track changes in vibration level or impulsive behaviour.
These indicators support detection and trending, but they do not necessarily distinguish the underlying fault. An overall value can rise for different reasons.
Fast Fourier Transform analysis separates the signal into frequency components. This makes it possible to examine changes in a particular part of the spectrum rather than relying on a single aggregate value.
The motor-looseness example illustrates this distinction. Additional peaks appeared between 500 Hz and 1 kHz when the bearing housing was loosened. The diagnostic information came from the distribution of vibration energy across frequency, not simply from the existence of vibration.
For machinery operating under changing speed or load, time-frequency methods can examine how frequency content evolves during the measurement. The processing method should therefore follow the operating behaviour of the asset as well as the suspected fault mechanism.
From an abnormal condition to a planned intervention
An actionable maintenance workflow connects the measurement to a sequence of decisions:
- Detect a departure from the established baseline.
- Examine the waveform and spectrum for a plausible fault signature.
- Track whether the relevant indicators remain stable or continue to increase.
- Evaluate the condition in the context of machine operation.
- Schedule the required inspection or maintenance action.
The output should be a maintenance decision rather than an unexplained alarm. A developing bearing condition, a loosened mounting point and a change in operating load may all alter vibration, but they do not call for the same response.
Where edge processing and machine learning fit
The sensor is the starting point of the monitoring system, not the complete predictive-maintenance solution.
An acquisition device collects the analog signal. Local processing can calculate FFT spectra, extract indicators and compare them with baseline values. Edge devices can perform these tasks near the machine, reducing the amount of raw waveform data transferred upstream.
A central monitoring platform can then aggregate trends across machines and sites. This supports comparisons between assets and the development of models using a broader operating history.
Machine learning can assist with fault classification and degradation modelling, but its usefulness depends on the measurement input. Sensor range, frequency response, mounting consistency and representative operating data remain fundamental to the analysis.
Remaining-useful-life estimation is a further step beyond fault classification. A system that recognises an abnormal bearing condition has not automatically established how long that bearing can continue operating.
Why sensor selection affects the maintenance outcome
Each sensor parameter limits what the monitoring system can observe.
Frequency response determines which parts of the vibration spectrum are captured. Sensitivity determines the voltage change produced by a given acceleration. Measurement range determines the acceleration span available before the sensor exceeds its rated range.
These parameters must be considered together. Selecting a higher sensitivity increases the output response to a small vibration input, but the available acceleration range may be lower. Conversely, a wider measurement range accommodates stronger vibration but produces a smaller voltage response when sensitivity is lower.
Mechanical integration is equally important. The monitoring system measures the vibration reaching the sensor through its mounting interface. Changing the mounting position or attachment method can change the response and reduce the value of long-term comparisons.
The integrated amplifier in the VS series simplifies the electrical interface, but the receiving acquisition system must still accommodate the output offset, signal swing and frequency content required for the selected analysis.
Application fit
The J-type format supports externally mounted measurement points where a detachable cable and threaded mounting are useful. The B-type format supports embedded installations with a smaller available mounting envelope.
The 2 mV/(m/s²), ±500 m/s² models accommodate higher-amplitude vibration. The VS-JV10A combines 10 mV/(m/s²) sensitivity with a ±100 m/s² range, while the VS-BV203-B combines 20 mV/(m/s²) sensitivity with a ±50 m/s² range.
Continuous acquisition supports condition trending. Fault diagnosis and remaining-useful-life estimation require additional processing beyond the sensor, including feature extraction, baseline comparison and trend analysis.
Design-in notes for engineers
- Match the acquisition input to the output offset and expected signal swing. Use an output load resistance of at least 100 kΩ.
- Select sensitivity against both the lowest vibration level of interest and the highest expected acceleration.
- Keep sensor location, orientation and mounting method consistent for repeatable trends. Mount the sensor firmly on a hard, flat surface close to the measurement point.
- Use a mounting torque of 1.5 N·m for the J-type sensor’s M4 mounting connection. The standard M8 cable connector requires 0.4 N·m.
- Account for the effect of magnetic mounting: surface material and condition affect the measured response.
- Leave the cable slightly slack and secure it to a stationary surface or the same surface as the sensor. Cable vibration can influence the output.
- Keep continuous mechanical pressure off the sensor body because housing distortion can affect performance.
- Establish baselines under representative machine speed, load and environmental conditions. Final selection should be validated under the actual operating conditions.
Conclusion – From periodic servicing to condition-informed maintenance
The transition from preventive to predictive maintenance begins with a change in the basis for action. A service interval provides a schedule; vibration monitoring provides evidence of how the machine is behaving within that interval.
Piezoelectric vibration sensors connect the mechanical condition of motors, bearings and pumps to an electrical measurement that can be trended and analysed. Their contribution is most useful when the installation, acquisition system and processing workflow preserve the features needed to detect and diagnose the relevant faults.
The distinction between measurement and prediction remains important. Continuous sensing supports condition awareness, spectral analysis supports diagnosis, and degradation modelling supports prognosis. Bringing these stages together allows maintenance planning to respond to measured deterioration rather than waiting for a scheduled inspection or a functional failure.
Further reading
- YAGEO Unveils Multilayer Piezoelectric Actuators
- Advances in Piezoelectric Haptic Sensors, How do they Work?
Source
This article is based on the YAGEO Group white paper below, product announcement and official product documentation. Engineers should refer to the current manufacturer datasheet for final design and qualification.
References
- Download the full YAGEO White Paper here: From Preventive Maintenance to Predictive Maintenance, Why Vibration Sensors Are the Key Enabler of Industrial Condition Monitoring, YAGEO October 2026
- VS Vibration Sensors, SE0209_VS, YAGEO Group / KEMET, September 2025.